ETH Range Rebound Analysis: Bullish Engulfing Challenges Downtrend
- CopyTradia Intelligence

- 5 days ago
- 5 min read
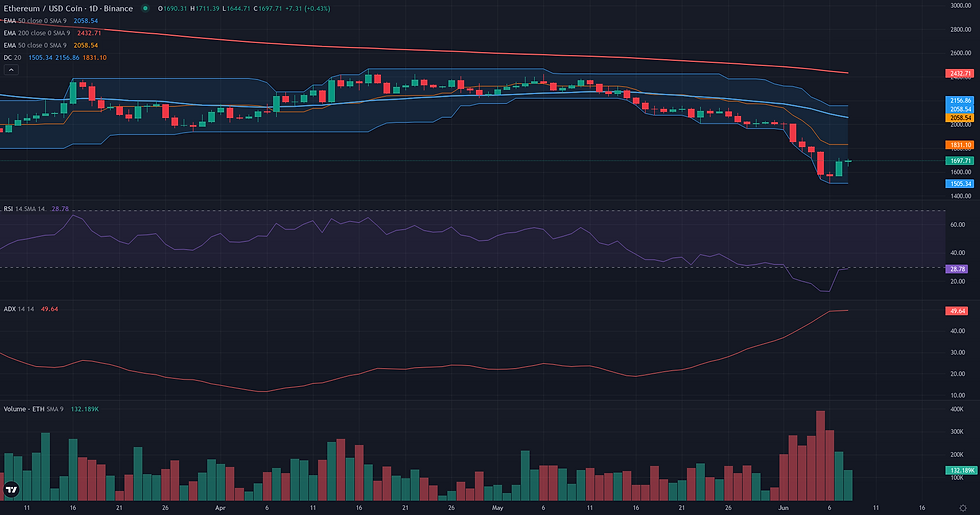
This ETH range rebound analysis examines the current ETH/USDC structure in the context of support defense and weakening alternative frameworks. Ethereum has experienced a severe price decline, pushing it to significant new lows and creating a state of extreme technical stress. The daily chart for ETH/USDC shows the price closing around 1690, substantially below key long-term moving averages like the D1 EMA 200 at 2546. This reflects a market under firm bearish control, a fact underscored by a very high D1 ADX reading of 49.44, which indicates the preceding downtrend was exceptionally strong. However, this downward momentum has driven the D1 RSI deep into oversold territory at 27.97, suggesting potential exhaustion. This technical picture of a potential bottoming process unfolds against a backdrop of extreme market fear and significant price depreciation, as recent fundamental analysis highlights a major deleveraging event across derivatives. The current structure is therefore defined by a conflict between the powerful established downtrend and emerging signs of a short-term reversal.

ETH Range Rebound Analysis: Support and Friction Zones
Following the plausible Range/Rebound framework identified for ETH/USDC, the resolution analysis begins from the validation zone of 1564-1721 USDC, defined by the D1 bullish engulfing candle. The coherence of this rebound scenario hinges on defending the recent structural low. An invalidation of the framework would occur with a daily close below the 1505 USDC area, which is reinforced by the D1 S2 pivot (1501.47), as this would negate the reversal pattern and suggest the downtrend is resuming. For the rebound to gain traction, it must first overcome a significant band of immediate friction. This zone lies between the engulfing candle’s high at 1720.51 and the D1 R1 pivot at 1752.69. A successful breakout here would be a primary confirmation signal. Beyond this, further friction is anticipated around the 1815-1891 area, corresponding to prior daily highs and the D1 R2 pivot. A more formidable resistance cluster is located near the 2000 USDC psychological level, which is technically anchored by the W1 R1 pivot (1971.41) and the descending D1 EMA 50 (2073.28). If the framework confirms and overcomes these hurdles, the first major projection zone is the W1 R1 pivot area around 1971 USDC. A more sustained recovery could target the W1 R2 pivot at 2252.43 USDC, a level that aligns with previous market structure. Conversely, the rebound attempt would show signs of weakening if it fails to clear the 1721 resistance and subsequently loses the D1 pivot at 1658.22, especially if upward moves continue to exhibit low volume.


Breakout: Structural Catalyst Assessment
The Breakout framework is assessed as not plausible in the current market context. The primary reason is the absence of the framework's core precondition: a phase of compression or consolidation beneath a well-defined resistance. Instead, the daily chart reveals a market in a strong, directional downtrend, a condition confirmed by a high D1 ADX reading of 49.44. Price is trading substantially below key structural moving averages such as the D1 EMA 50 at 2073.28 and the W1 EMA 50 at 2635.13, reinforcing the bearish control. While a recent D1 bullish engulfing pattern and an oversold RSI at 27.97 suggest potential for a short-term corrective bounce from the recent low of 1505.34, these signals point towards bearish trend exhaustion rather than the constructive accumulation of energy required for a structural breakout. For this framework to become relevant, the market would first need to halt its descent and establish a prolonged period of stabilization and range-bound trading below a significant resistance area.
Continuation: Directional Flow Assessment
The technical structure for ETH/USDC presents a conflicting picture for a bearish continuation. On one hand, the dominant trend is unequivocally bearish. Price is trading significantly below key long-term moving averages on both the daily (D1 EMA50 at 2073.28) and weekly (W1 EMA50 at 2635.13) charts. This downward trajectory is supported by a very high D1 ADX of 49.44, which confirms the presence of a powerful, established trend. The recent sharp decline was also accompanied by a surge in volume, lending credibility to the sellers' control. However, this strong bearish context is directly challenged by signs of acute short-term exhaustion. The daily RSI has fallen into oversold territory (27.97), a condition that often precedes a corrective bounce or consolidation. More critically, the price action on June 7th formed a large bullish engulfing candle, a classic reversal pattern that signals a significant influx of buying pressure at the recent lows around 1560. This bounce is not a minor hesitation; it has a clear structure on the H1 timeframe and suggests that the path of least resistance may not be immediately downwards. Therefore, while the overarching framework remains bearish, the immediate risk of a more sustained counter-trend rally makes a direct continuation borderline. The framework's plausibility hinges on whether sellers can quickly absorb this bounce and invalidate the reversal pattern.

Comparative Framework Verdict
In this week's ETH technical analysis, three strategic frameworks were assessed, yielding a clear hierarchy of plausibility. The Range/Rebound framework emerges as the most dominant scenario. Its plausibility is built on a strong confluence of daily reversal signals: a powerful bullish engulfing candle, an oversold D1 RSI, and a bullish crossover in the D1 Stochastics. These factors suggest that the recent sharp sell-off may have found at least temporary support, with the framework's validity centered on the 1564-1721 price zone defined by the key reversal candle. In a secondary position, the bearish Continuation framework is rated as borderline. While it aligns with the powerful, overarching downtrend confirmed by a high ADX and price action far below key moving averages, its immediacy is questioned by the same potent reversal signals that support the rebound scenario. The bullish engulfing candle acts as a significant counter-signal that must be invalidated for the downtrend to resume. Finally, the Breakout framework is considered not plausible. The market is currently characterized by strong directional movement and trend expansion, which is the antithesis of the consolidation and volatility compression required for a structural breakout. The key element to monitor will be whether the nascent buying pressure can defend the recent lows and build a constructive base, or if sellers overwhelm the rebound attempt, confirming the continuation of the broader bearish trend.
For broader market context, readers can also review the latest related fundamental analysis for this pair.
For live market monitoring and the full interactive chart, readers can access the dedicated ETH Market Hub.
Disclaimer
CopyTradia provides technical analysis for informational and educational purposes only. This content does not constitute financial advice, investment recommendations, or trading signals. Cryptocurrency markets are highly volatile. Past performance is not indicative of future results. Always conduct your own research (DYOR) and consult a qualified financial advisor before making any investment decisions.

Comments