ETH Bearish Continuation Analysis: Price Enters Oversold Territory
- CopyTradia Intelligence

- Jun 4
- 4 min read
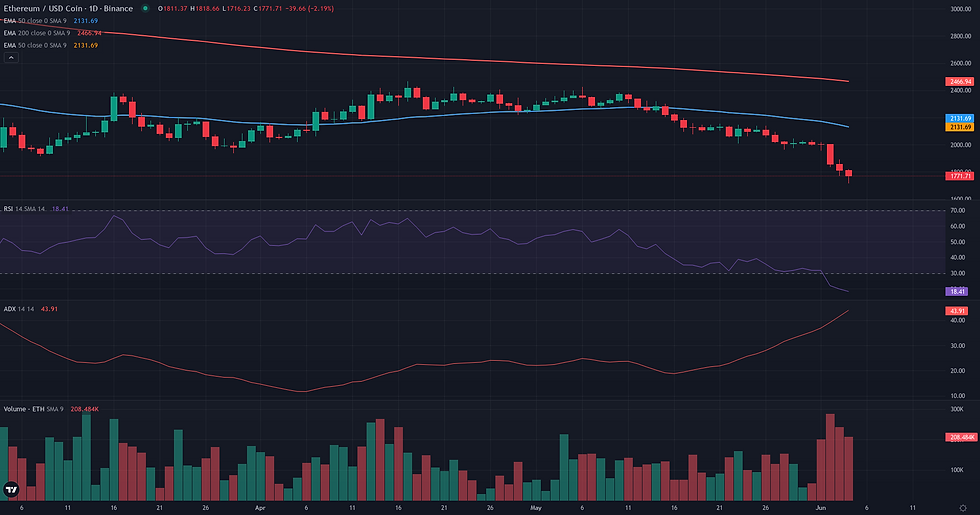
This ETH bearish continuation analysis examines the current ETH/USDC structure in the context of support defense and weakening alternative frameworks. ETH/USDC is currently navigating a period of intense bearish pressure, closing the daily session at 1811.37. The market structure is defined by a powerful, high-momentum downtrend, confirmed by a D1 ADX reading of 41.49, which indicates a very strong directional move. Price action remains significantly below key long-term averages like the 50-day EMA (2146.39) and 200-day EMA (2557.27), reinforcing the established bearish regime. This technical picture of sustained weakness aligns with the fundamental context of cautious market positioning and a persistent decline in spot price. However, a notable tension is emerging, as the D1 RSI has fallen to a deeply oversold level of 20.00. This suggests the recent downward leg is overextended, potentially leading to a period of consolidation or a technical bounce, even as the dominant trend remains firmly negative. Volatility remains elevated, with a daily NATR of 4.47%, highlighting the risk of sharp price movements.

Range & Rebound: Market Structure Assessment
The Range/Rebound framework is assessed as not plausible in the current market structure. The primary reason for this conclusion is the prevailing market dynamic, which is one of strong, accelerating bearish momentum rather than the required stabilization or controlled reversal. The D1 ADX reading of 41.49 confirms a powerful, trending environment, which is fundamentally at odds with the formation of a range. Structurally, the price has recently breached several layers of support, including the psychological 2000 level and the calculated weekly pivots W1 S1 (1933.21) and W1 S2 (1861.38). This breakdown suggests trend continuation, not exhaustion. While the D1 RSI has reached a deeply oversold level of 20.00, which might hint at a potential for a technical bounce, this single counter-trend signal is insufficient to build a plausible rebound case against the weight of the structural and momentum evidence. For this framework to become relevant, a clear deceleration of the bearish trend and the establishment of a new, identifiable price floor over multiple sessions would be necessary.

Breakout: Structural Catalyst Assessment
The Breakout framework is assessed as not plausible for ETH/USDC at this time. The market structure is fundamentally misaligned with the framework's core requirement of price compression below a defined resistance. Instead of consolidation, the daily chart displays a strong and active downtrend, characterized by the recent creation of a new 20-day low at 1767.81. This bearish dynamic is confirmed by momentum indicators; the ADX D1 at 41.49 signals a powerful, established trend, while the RSI D1 at 20.00 indicates deeply oversold conditions driven by intense selling pressure. Furthermore, the price is trading substantially below key structural references like the EMA 50 D1 (2146.39), reinforcing the bearish control. The weekly context offers no counter-signal, with price action also in a clear downtrend. For a Breakout framework to become relevant, a significant structural change would be required, starting with the cessation of new lows and a period of stabilization, followed by the eventual reclaim of major resistance levels.

ETH Bearish Continuation Analysis: Directional Flow Assessment
The technical structure for ETH/USDC presents a plausible case for a bearish continuation. The daily chart displays a clear and orderly downtrend, defined by a consistent series of lower highs and lower lows over the past month. This directional flow is not only visually apparent but is also confirmed by multiple indicators. The price is trading substantially below its 50-day (2146.39) and 200-day (2557.27) exponential moving averages, a classic signature of a stable bearish regime. Furthermore, the trend's strength is underscored by a D1 ADX reading of 41.49, indicating a powerful and established movement. The recent acceleration to the downside, breaking below the 2000 level, was supported by a significant volume surge, with the Volume Oscillator at 40.05, lending credibility to the move. This daily picture is reinforced by the weekly context, which shows a broader, multi-month decline. The primary factor tempering this outlook is the D1 RSI, which currently sits at an oversold level of 20.00. While this suggests the market is overextended to the downside and could experience a short-term consolidation or corrective bounce, it does not, in itself, invalidate the dominant trend structure in such a high-momentum environment.
Comparative Framework Verdict
Comparing the three strategic frameworks, the analysis reveals a clear hierarchy dictated by the prevailing market conditions. The bearish Continuation framework stands out as the only plausible scenario. Its validity is rooted in the strong, established downtrend confirmed by a high D1 ADX (41.49) and price action consistently making lower lows below all major moving averages. The recent breakdown below the former weekly support at 1933.21, which now serves as a validation level, further strengthens this outlook. Conversely, both the Range/Rebound and Breakout frameworks are assessed as not plausible. Their core requirements—market stabilization for a rebound and price compression for a breakout—are fundamentally absent. The market is not consolidating; it is actively trending downwards with significant momentum. The only counter-signal is the deeply oversold D1 RSI (20.00), which acts as a weakening factor for the continuation case but is insufficient on its own to validate a reversal. Therefore, the dominant technical narrative is one of bearish persistence, with the key element to monitor being whether the oversold conditions can trigger a temporary pause or if sellers will maintain control and push prices lower.
For broader market context, readers can also review the latest related fundamental analysis for this pair.
For live market monitoring and the full interactive chart, readers can access the dedicated ETH Market Hub.
Disclaimer
CopyTradia provides technical analysis for informational and educational purposes only. This content does not constitute financial advice, investment recommendations, or trading signals. Cryptocurrency markets are highly volatile. Past performance is not indicative of future results. Always conduct your own research (DYOR) and consult a qualified financial advisor before making any investment decisions.


