Analyzing the Ethereum Market State Amidst Sustained Weakness
- CopyTradia Intelligence

- Jun 1
- 3 min read
Ethereum concluded the week under continued downward pressure, marked by negative price performance and relative underperformance against Bitcoin. The **Ethereum market state** is characterized by a sustained decline in spot price, coupled with a notable compression in realized volatility compared to its historical baseline. While speculative positioning shows a slight increase in Open Interest over the past seven days, it remains below the longer-term average, suggesting a cautious but not entirely deleveraged environment amidst deteriorating market sentiment.
Spot Price and Volatility Analysis
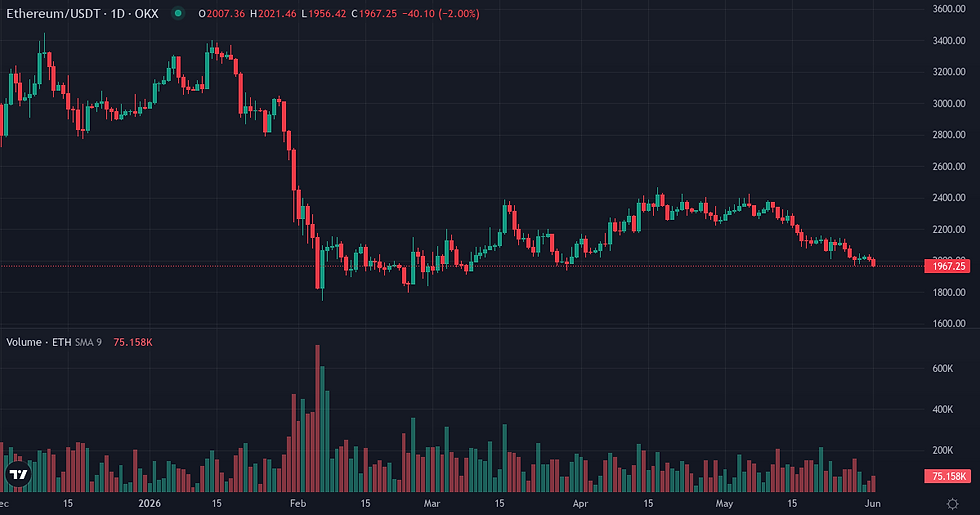
Ethereum's spot price closed the week at $1964.05, reflecting a -7.18% decline over the past seven days and a -14.72% decrease over the last 30 days. This indicates a persistent downward trend in its valuation. Realized volatility for the 7-day period was 38.59% and 34.61% for the 30-day period, both significantly below the 90-day baseline of 53.70%, suggesting a compression of price movements despite the negative direction. Against Bitcoin, Ethereum underperformed by -0.5071% over the past week and -6.7724% over the past month, with the ETH/BTC ratio standing at 0.027298, a decline from 0.027442 a week prior. This sustained underperformance points to a continued rotation of capital away from Ethereum relative to the benchmark. Structurally, Ethereum remains 60.29% below its all-time high.

Metric | Value |
ETH Price | $1,964 (-2.26% 24h / -7.18% 7d / -14.72% 30d) |
Volume 24h | $14.88B |
Native Quote Vol. 24h | $81.3M |
Market Cap | $237.04B |
Market Cap Rank | 2 |
Circulating Supply | 120.69M ETH |
ATH Distance | 60.29% below ATH |
Metric | Value |
ETH/BTC Ratio | 0.02730 |
Relative Perf. 7d vs BTC | -0.51% |
Relative Perf. 30d vs BTC | -6.77% |
Speculative Positioning and Liquidations
Speculative positioning for Ethereum shows a nuanced picture. Open Interest increased by 1.24% over the past seven days to $4.566 billion, yet this figure remains below the 90-day baseline of $4.721 billion, indicating that overall leveraged participation has not fully recovered to prior levels. The current funding rate is 0.005339%, with a 7-day cumulative rate of 0.031819%. The 30-day funding Z-score of 0.5243 is above the 30-day average of 0.003306%, suggesting a slight positive bias in funding despite the recent price declines. Over the last seven days, long liquidations totaled $695.8 million, accounting for 72.8% of total liquidations, significantly outweighing short liquidations of $259.7 million. While the 30-day average for long liquidations is 67.5%, the recent week shows a pronounced bias towards long positions being unwound, even as the overall 30-day directional skew is described as balanced.
Metric | Value |
Funding Rate (current) | +0.0053% |
Funding Cumul. 7d | +0.0318% |
Open Interest | $4.57B (+1.24% 7d) |
Liq. 24h Longs | $23M |
Liq. 24h Shorts | $3M |
Liq. 7d Longs | $696M |
Liq. 7d Shorts | $260M |
Metric | Value |
Realized Vol 7d | +38.59% (90d avg: +53.70%) |
Realized Vol 30d | +34.61% |
Corr. BTC 30d | 0.9327 (90d avg: 0.9378) |
Beta vs BTC | 1.1310 |
Volume Momentum | 0.4425x |
Funding Z-Score 30d | 0.52σ |
Turnover Ratio | 0.0628 |
Liq. Intensity | 0.00403 |
Key Dynamics to Monitor
Several dynamics warrant monitoring in the coming week. A continued decline in Ethereum's relative performance against Bitcoin, particularly if the ETH/BTC ratio breaks further below its current levels, would signal an acceleration of capital rotation. The behavior of Open Interest will be critical; a sustained increase above the 90-day baseline could indicate renewed speculative interest, while a sharp contraction might suggest further deleveraging. The ongoing compression in realized volatility, significantly below its 90-day average, could precede a more decisive price movement once this consolidation resolves. External macro factors, including the upcoming US labor market data such as the ADP Non-Farm Employment Change, Non-Farm Employment Change, and Unemployment Rate, alongside the ISM Services PMI, could introduce broader market volatility that may interact with Ethereum's internal dynamics.
Indicator | Value | Variation |
Broad Dollar Index | 119.29 | flat (7d) |
US 10Y Yield | 4.45% | -0.05pp (7d) |
Fed Balance Sheet | $6704B | -$9,260M (7d) |
M2 Money Supply | $22,805B | +$118.1B (1m) |
Fear & Greed | 29 (Fear) | -5 pts (7d) |
Fear & Greed Index: Alternative.me
Ethereum Weekly Takeaway
Ethereum concludes the week in a regime of sustained price depreciation and relative weakness against Bitcoin, characterized by a notable compression in realized volatility. The market is navigating a period of internal tension, where price declines have been accompanied by significant long liquidations, yet Open Interest shows some resilience, albeit below its longer-term average. This suggests a market that is actively shedding leveraged long exposure in a controlled manner, rather than experiencing a full capitulation. The prevailing sentiment remains fearful, indicating a cautious approach from market participants as the asset continues to underperform the broader crypto benchmark.
Disclaimer
This article provides a fundamental analysis of Ethereum's market state based on available data and does not constitute investment advice or a recommendation to buy or sell any asset.


