Ethereum Downtrend Analysis: Strength vs. Oversold Conditions
- CopyTradia Intelligence

- Jun 11
- 4 min read
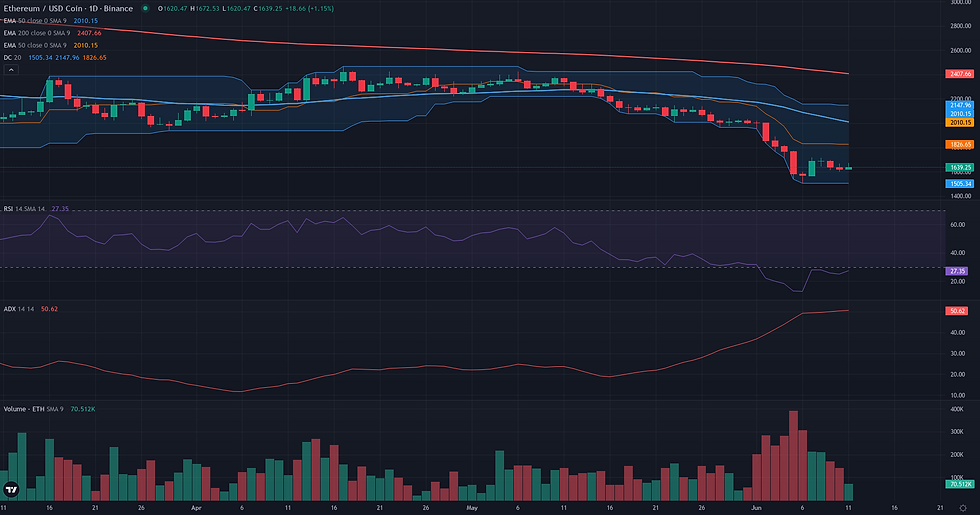
This Ethereum downtrend analysis examines the current ETH/USDC structure in the context of support defense and weakening alternative frameworks. Ethereum is currently navigating a period of high technical tension, trading near its weekly low around 1620 USDC after a significant price decline. The market structure is defined by a powerful downtrend, confirmed by an exceptionally high daily ADX reading of 50.37, which signals a mature and forceful directional move. However, this bearish momentum is being challenged by signs of potential seller exhaustion, as the daily RSI has fallen into deeply oversold territory at 25.00. This conflict has led to a recent consolidation, with price action stalling just above the key 1505 USDC support level. This technical tension is unfolding against a backdrop of significant market deleveraging and extreme fear, as noted in recent fundamental analysis, suggesting the current pause could be a critical decision point for the market's next major move. The resolution of this standoff between trend strength and momentum exhaustion will likely dictate the directional bias in the coming sessions.

Ethereum Downtrend Analysis: Technical Framework Assessment
The resolution for the ETH/USDC Range/Rebound framework is defined by a clear conflict between oversold technical readings and a powerful, prevailing downtrend. For the rebound scenario to gain traction, it must first achieve a sustained break of the validation zone between 1690 and 1721 USDC, which marks the peak of the recent bounce. The framework's structural invalidation point is unambiguous: a daily close below the key swing low at 1505.34 USDC. Such a move would negate the rebound thesis entirely and signal a decisive continuation of the bearish trend. Should the price clear the validation zone, it will face immediate friction around the Weekly Pivot at 1738.38 USDC. Overcoming this level is the first step toward confirming buyer intent. A more formidable obstacle awaits further up, in the 1970-2030 USDC range. This area represents a significant resistance cluster, containing both the Weekly R1 pivot (1971.41) and the daily 50-period exponential moving average (2025.30). If the rebound successfully navigates these friction zones, the W1 R1 at 1971.41 serves as the primary technical projection. A more optimistic resolution, indicating a potential structural reversal, could target the W1 R2 pivot at 2252.43 USDC. Conversely, the framework will show signs of weakening if the price is rejected from the 1721 USDC resistance and subsequently breaks below the daily pivot at 1629.92, suggesting that sellers are regaining control.


Breakout: Structural Catalyst Assessment
The Breakout framework is currently not plausible for ETH/USDC. The market structure is characterized by a strong, established downtrend rather than the necessary pre-breakout consolidation. Price is trading near its recent lows, as defined by the Donchian 20 D1 lower boundary at 1505.34, and remains significantly below key trend indicators such as the D1 EMA50 at 2025.30. This positioning reflects a bearish continuation dynamic, which is antithetical to the concept of building energy below a resistance level. Momentum indicators corroborate this reading: the D1 ADX at a high value of 50.37 confirms the exceptional strength of the current downtrend, while the D1 RSI at 25.00 indicates an oversold condition, a sign of weakness, not of latent buying pressure. Furthermore, recent volume spikes have accompanied sharp price declines, suggesting distribution rather than accumulation. For the Breakout framework to become relevant, a clear structural shift would be required, such as the formation of a stable price base and a subsequent period of compression below a well-defined resistance level.
Continuation: Directional Flow Assessment
The current market structure presents a borderline case for a bearish continuation. On one hand, the directional flow is powerfully bearish. A recent, high-volume breakdown on the weekly chart has shattered a multi-month support level, and the daily price action is defined by a steep decline far below key moving averages like the D1 EMA50 at 2025.30. The trend's strength is underscored by an exceptionally high ADX D1 reading of 50.37, indicating a dominant and established directional move. On the other hand, this aggressive downside push has driven the D1 RSI into deeply oversold territory at 25.00. This signals a potential exhaustion of momentum and is corroborated by the recent price action, which has stalled into a tight consolidation just above the 1505 low. This creates a structural tension: the overarching trend is clearly down, but the immediate risk of a corrective bounce is elevated. The resolution of this tension will likely depend on whether the price can break below the recent 1505 low to confirm continuation, or if it reclaims resistance around the weekly pivot of 1738.38, which would suggest a more significant correction is underway.

Comparative Framework Verdict
The comparative analysis of the three technical frameworks reveals a market at a crossroads, with no single scenario holding a dominant probability. Both the bearish Continuation and the bullish Range/Rebound frameworks are rated as borderline, as they each capture one side of the same core conflict: a powerful downtrend clashing with momentum exhaustion. The Continuation framework finds its support in the exceptionally strong daily ADX of 50.37 and the price trading far below key moving averages, suggesting the path of least resistance remains downwards. Conversely, the Range/Rebound framework is supported by a deeply oversold daily RSI of 25.00 and price action finding at least temporary support near the daily and weekly lower Bollinger Bands, signaling conditions ripe for a corrective bounce. The Breakout framework is deemed not plausible, as the current market structure is one of directional trending, not the necessary consolidation and compression below a clear resistance. Ultimately, the market's direction hinges on resolving this tension. A decisive daily close below the recent low of 1505 USDC would validate the Continuation framework. In contrast, a sustained reclaim of the resistance zone between 1690 and 1740 USDC would invalidate the immediate bearish pressure and lend credibility to the Range/Rebound scenario.
For broader market context, readers can also review the latest related fundamental analysis for this pair.
For live market monitoring and the full interactive chart, readers can access the dedicated ETH Market Hub.
Disclaimer
CopyTradia provides technical analysis for informational and educational purposes only. This content does not constitute financial advice, investment recommendations, or trading signals. Cryptocurrency markets are highly volatile. Past performance is not indicative of future results. Always conduct your own research (DYOR) and consult a qualified financial advisor before making any investment decisions.


