Ethereum Bearish Trend Analysis: Price Tests 2000 USDC Support
- CopyTradia Intelligence

- Jun 2
- 5 min read
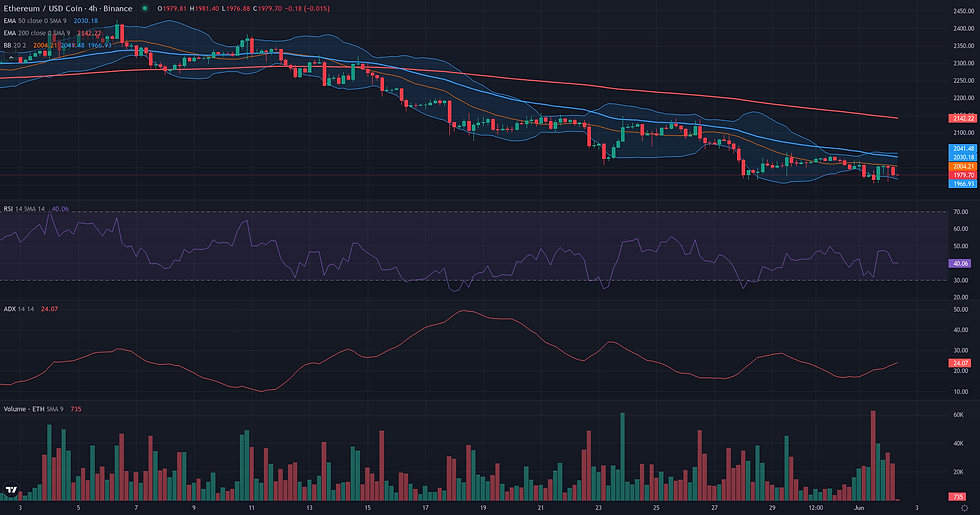
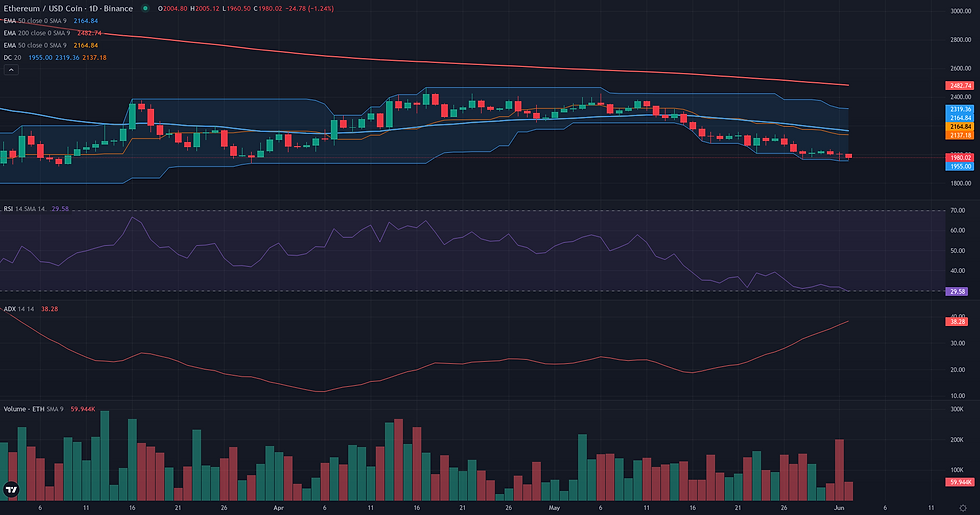
This Ethereum bearish trend analysis examines the current ETH/USDC structure in the context of support defense and weakening alternative frameworks. Ethereum is currently navigating a critical juncture, testing a support zone around the 2000 USDC level after a sustained period of decline. The market structure is defined by a strong bearish trend, confirmed by a high Daily ADX reading of 36.88, which indicates significant directional momentum. Price action remains well below key long-term moving averages, such as the Daily 200-period EMA at 2553.94, reinforcing the dominant downward pressure. Momentum oscillators reflect this weakness, with the Daily RSI at 31.77, hovering just above oversold territory without showing signs of a decisive recovery. This technical posture aligns with the broader market state, which is characterized by a sustained price decline alongside a notable compression in realized volatility, suggesting a cautious market environment rather than a capitulation. The current consolidation near recent lows places the focus squarely on the market's ability to either defend this support or continue its established downtrend.
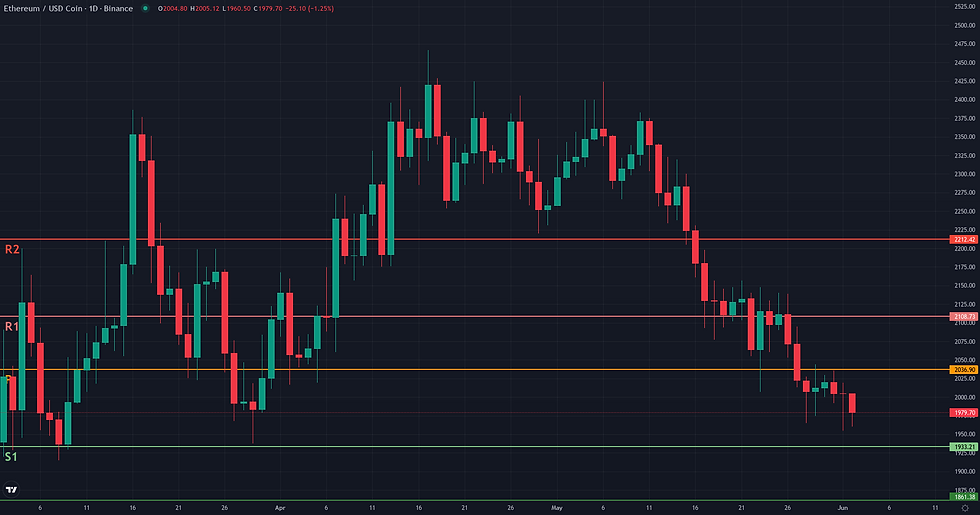
Range & Rebound Resolution: Support and Friction Zones
The resolution framework for this borderline Range/Rebound scenario hinges on the market's reaction to the 1955-2000 USDC support zone. The validation condition, defined as a sustained break above the D1 middle Bollinger Band at 2105.52, serves as the primary threshold for confirming a potential shift in momentum. This level's importance is underscored by its confluence with the weekly R1 pivot at 2108.73, making it a formidable initial resistance. The invalidation of this rebound framework would occur with a decisive structural failure at the current support. A daily close below the 1955-1966 area, defined by recent lows and the daily S1 pivot, would signal that sellers have absorbed the demand and are resuming the downtrend. Such a breakdown would open the path towards the next significant support cluster around 1928-1933, where the daily S2 and weekly S1 pivots converge. Should the framework validate, the path upward is not without obstacles. Key friction zones include the D1 EMA 50 at 2172.38, a dynamic resistance that has capped previous bounces, and a weekly resistance cluster around 2212-2217 (W1 R2 / W1 middle BB). Overcoming these levels would be necessary to sustain the rebound. A successful resolution would project towards prior structural zones, initially targeting the 2350-2420 consolidation area, with a more significant macro reference at the 2550 USDC confluence of the D1 and W1 200-period EMAs. Confirmation of the rebound's strength would involve turning the 2105 validation level into support and breaking the next friction zone. Conversely, weakening would be evident if the price is repeatedly rejected from this validation level or fails to hold above the weekly pivot at 2036.90, indicating the rebound attempt lacks conviction.

Breakout: Structural Catalyst Assessment
The Breakout framework is currently not plausible for ETH/USDC. The market structure is characterized by a persistent and technically confirmed downtrend, which is fundamentally at odds with the prerequisites of a bullish breakout. The daily ADX, at a high value of 36.88, signals a strong trend, and with price action consistently making lower lows and trading well below the D1 EMA50 (2172.38) and D1 EMA200 (2553.94), the direction of this trend is unambiguously downward. Furthermore, the core condition of a pre-breakout compression phase is absent; instead of consolidating under a resistance ceiling, the price is in a dynamic decline. This is corroborated by weak momentum, with the D1 RSI at 31.77, indicating selling pressure rather than the accumulation of energy needed for a structural break to the upside. For this framework to become relevant, the current downward trajectory would need to cease, followed by the formation of a clear consolidation range and a significant recovery in momentum indicators.
Ethereum Bearish Trend Analysis: Directional Flow Assessment
The technical structure for ETH/USDC presents a plausible case for a bearish continuation, anchored in a dominant and coherent downtrend visible on both daily and weekly timeframes. Price is evolving well below key structural moving averages, including the Daily EMA 50 at 2172.38 and the Weekly EMA 200 at 2544.46, confirming a well-established bearish regime. The trend's directional strength is underscored by a robust Daily ADX reading of 36.88, which indicates this is not a ranging market but a persistent directional flow. Recent price action has formed a tight consolidation near the recent low of 1955.00, a pattern that often precedes further downside as buyers have failed to produce any significant rebound. The primary limiting factor is the Daily RSI, which at 31.77 is approaching oversold territory. While this suggests the potential for a temporary bounce, it does not yet contradict the overwhelming structural evidence pointing towards a continuation of the prevailing downtrend.

Comparative Framework Verdict
Comparing the three strategic frameworks, the bearish Continuation scenario emerges as the most plausible. This view is supported by a coherent and strong downtrend, evidenced by a high Daily ADX and price trading significantly below key moving averages. The validation for this framework hinges on the price failing to reclaim the 2037-2045 USDC resistance area, which would confirm that sellers remain in control. Rated as borderline, the Range/Rebound framework presents a viable secondary scenario. It highlights the conflict between the strong bearish trend and the fact that price is attempting to stabilize at a historically significant support zone between 1955 and 2000 USDC. While the location is logical for a potential bounce, the persistent bearish momentum makes this a counter-trend proposition that requires further confirmation, such as a break above the 2105 USDC level. The Breakout framework is considered not plausible at this time. The market lacks the necessary pre-breakout conditions, such as a period of consolidation and energy accumulation under a clear resistance. Instead, the structure is defined by a dynamic downtrend. In summary, the technical outlook favors the continuation of the current downtrend. The key element to monitor is the market's reaction to the 1955-2000 USDC support floor. A failure to hold this level would validate the continuation thesis, while a strong defense could lend credibility to the borderline rebound case.
For broader market context, readers can also review the latest related fundamental analysis for this pair.
For live market monitoring and the full interactive chart, readers can access the dedicated ETH Market Hub.
Disclaimer
CopyTradia provides technical analysis for informational and educational purposes only. This content does not constitute financial advice, investment recommendations, or trading signals. Cryptocurrency markets are highly volatile. Past performance is not indicative of future results. Always conduct your own research (DYOR) and consult a qualified financial advisor before making any investment decisions.


