SUI Weekly Indecision Analysis: Setups Clash

This SUI weekly indecision analysis examines the current SUI/USDC structure in the context of support defense and weakening alternative frameworks. SUI/USDC is navigating a period of significant technical indecision, currently trading around 0.77 USDC after pulling back from recent highs. The price is precariously balanced, holding above the key D1 50-period EMA at 0.75 USDC but remaining firmly below the longer-term D1 200-period EMA at 0.90 USDC. This precariousness is reflected in momentum indicators, with a neutral D1 RSI of 52.24 failing to signal conviction, while a high D1 ADX of 31.47 suggests the market is in a trending mode, creating a conflict with potential consolidation patterns. This technical tension aligns with recent fundamental analysis for this pair, which highlighted a surge in market activity and expanding leveraged interest, suggesting the market is primed for volatility but lacks a clear directional consensus. As the weekly range develops between 0.70 and 0.82 USDC, the market structure presents several conflicting but viable paths forward.

SUI Weekly Indecision Analysis: Technical Framework Assessment
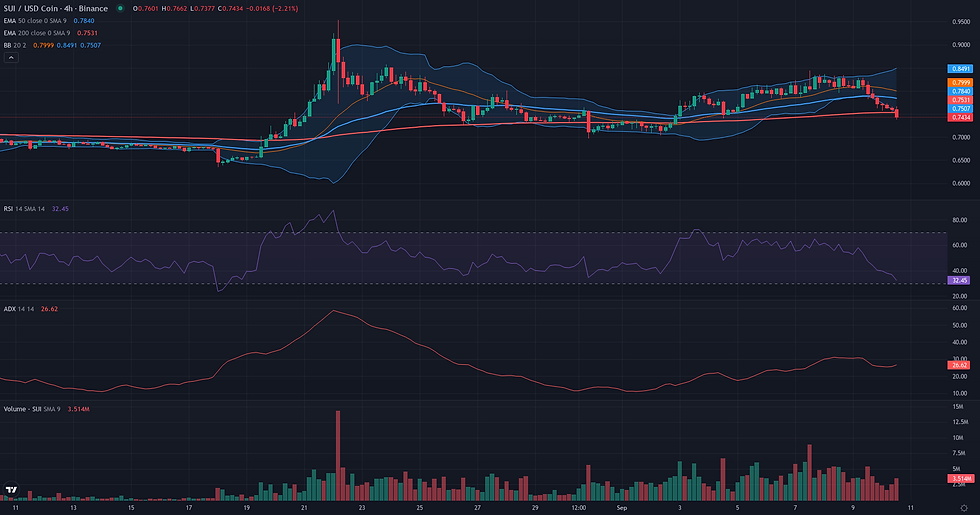
The resolution of the SUI/USDC Range/Rebound framework hinges on the market's reaction to the 0.70 - 0.74 USDC validation zone. This area, defined by the D1 Bollinger Band lower and the W1 S1 pivot, represents the critical support for the potential range structure. A definitive daily close below 0.70 USDC would invalidate this framework, signaling a failure of the range bottom and a likely continuation of the bearish trend. Before the validation zone is even tested, the rebound faces immediate friction at 0.75 USDC, a confluence of the D1 EMA 50 and D1 S1 pivot. A breakdown here would be a significant weakening signal. Should buyers step in, the first major obstacle lies at the 0.78-0.79 USDC pivot cluster. Overcoming this resistance is the minimum requirement for the rebound to demonstrate any credibility. A more significant hurdle awaits at 0.81-0.82 USDC, a zone of prior consolidation. If the rebound successfully navigates these friction zones, the primary technical projection is the 0.85 USDC level. This area, where the W1 R1 and D1 R2 pivots converge, aligns with the late-August highs and represents the logical upper boundary of the potential range. Confirmation of the rebound's strength would come from reclaiming the 0.79-0.81 USDC area, while a sustained trade below 0.75 USDC would suggest the framework is losing coherence, paving the way for a test of the invalidation level.

Breakout: Structural Catalyst Assessment
The Breakout framework for SUI/USDC presents a borderline case, defined by a tension between a constructive daily chart and a challenging weekly context. On the D1 timeframe, the structure is technically sound for a potential breakout. Following a strong impulse move to a high of 0.95, the price has entered a consolidation phase, holding above the EMA 50 D1 at 0.75. This consolidation is compressing against a well-defined resistance ceiling around 0.85-0.86, a level marked by the W1 R1 pivot and the upper D1 Bollinger Band. This price action is characteristic of a market preparing for a potential continuation. However, this bullish local structure is tempered by significant headwinds from the weekly chart. The W1 RSI at 44.75 is in bearish territory, and the price remains far below major long-term averages like the W1 EMA 50 at 1.29, suggesting the broader trend is not supportive. Furthermore, the D1 RSI at 52.24 is neutral, lacking the strong buildup of momentum that would add conviction to a breakout scenario. This conflict between the D1 setup and the W1 context makes the framework borderline, as a breakout would be a counter-trend move facing significant potential friction.

Continuation: Directional Flow Assessment
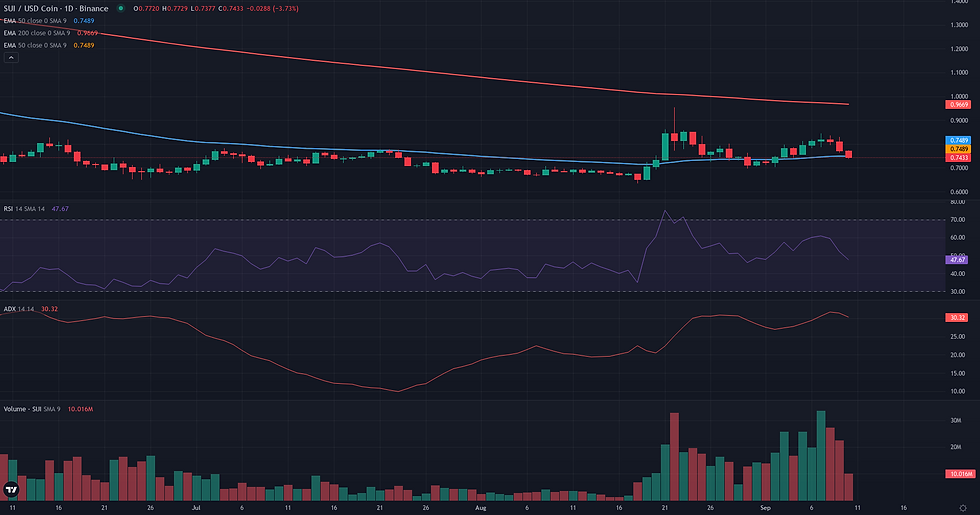
The technical structure for SUI/USDC presents a borderline case for a bullish continuation. The primary supporting element is the powerful D1 impulse wave from late August, which drove the price from 0.64 to 0.95 and established a clear bullish intent. The subsequent pullback has found the price trading above its D1 EMA50 at 0.75, a classic area for a potential trend resumption. However, significant factors challenge this outlook. The pullback has recently intensified, with the last daily session showing a decisive rejection and a close below the Weekly Pivot at 0.78. This immediate weakness is confirmed by the H1 timeframe, which depicts a sharp sell-off. Furthermore, the weekly context remains broadly bearish, with price trading far below its key moving averages, suggesting any D1 uptrend is a counter-move within a larger corrective structure. This creates a structural tension: while the D1 chart holds the potential for another upward leg, the lack of higher-timeframe support and the recent aggressive selling pressure prevent a clean 'plausible' reading.
Comparative Framework Verdict
In the current SUI weekly technical analysis, no single framework emerges as dominant, with the Range/Rebound, Breakout, and Continuation scenarios all rated as borderline. This reflects a market at a critical juncture, where competing technical arguments create a state of equilibrium and indecision. The market is caught between potential bullish structures on the daily timeframe and significant counter-signals from both short-term price action and the broader weekly context. The Range/Rebound framework identifies a potential consolidation zone, but its plausibility is challenged by a high D1 ADX, which typically signals a trending, not ranging, environment. Conversely, the bullish Breakout and Continuation frameworks draw strength from the strong upward impulse in late August and the price holding above the D1 50-period EMA. However, these scenarios are significantly weakened by a bearish weekly backdrop and recent aggressive selling pressure that has pushed the price below key short-term pivots. This creates a clear structural conflict. The resolution hinges on key levels: for bullish frameworks to gain traction, buyers must defend the support cluster around 0.74-0.75 USDC and reclaim higher ground. A failure to do so would weaken the bullish thesis and lend weight to the range-bound or even a bearish scenario, with the 0.70 USDC level acting as a critical floor. Monitoring the market's reaction at these boundaries will be essential to determine which technical narrative prevails.
For broader market context, readers can also review the latest related fundamental analysis for this pair.
For live market monitoring and the full interactive chart, readers can access the dedicated SUI Market Hub.
Disclaimer
CopyTradia provides technical analysis for informational and educational purposes only. This content does not constitute financial advice, investment recommendations, or trading signals. Cryptocurrency markets are highly volatile. Past performance is not indicative of future results. Always conduct your own research (DYOR) and consult a qualified financial advisor before making any investment decisions.


