SUI Derivatives Activity Signals Evolving Market Dynamics

SUI has concluded the week with notable upward price movement across short and medium-term horizons, accompanied by a significant increase in market activity and volatility. This period is characterized by expanding leveraged interest, which introduces new dynamics into its market structure, particularly concerning SUI derivatives activity.
SUI Price Action and Volatility
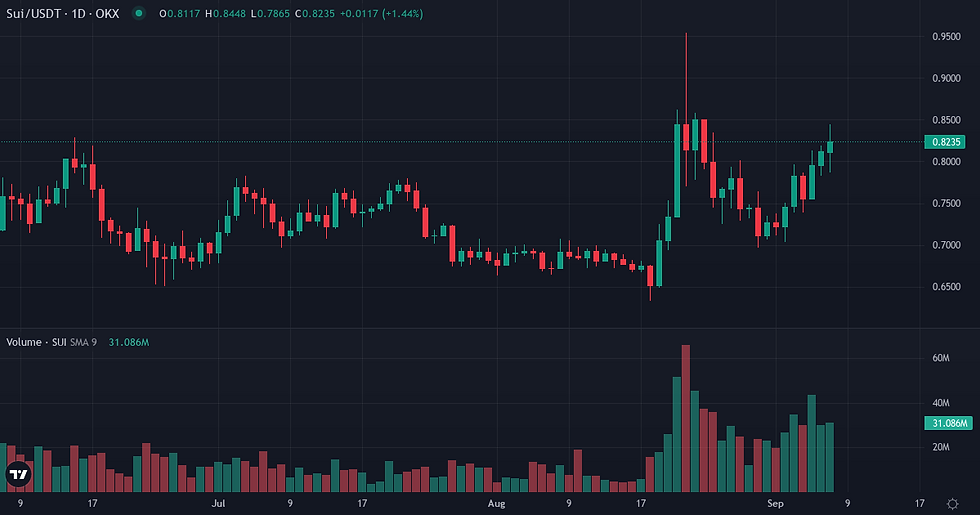
SUI's market regime this week is defined by sustained upward price momentum, with the asset appreciating by 15.40% over seven days and 19.50% over the past month, reaching a spot price of $0.83. This price action has coincided with elevated volatility, as the 7-day realized volatility stands at 97.23%, notably above its 90-day baseline of 66.58%. Against Bitcoin, SUI demonstrated short-term outperformance, gaining 5.1151% over the last seven days, yet it registered a 5.0361% underperformance over the 30-day period. The asset maintains a high 30-day correlation of 0.8021 with Bitcoin and a beta of 1.444, indicating its tendency to amplify BTC's movements. Structurally, SUI remains 84.56% below its all-time high.
Metric | Value |
SUI Price | $0.83 (+4.96% 24h / +15.40% 7d / +19.50% 30d) |
Volume 24h | $724.9M |
Native Quote Vol. 24h | $29.3M |
Market Cap | $3.38B |
Market Cap Rank | 30 |
Circulating Supply | 4.10B SUI |
ATH Distance | 84.56% below ATH |
Metric | Value |
SUI/BTC Ratio | 0.00001000 |
Relative Perf. 7d vs BTC | +5.12% |
Relative Perf. 30d vs BTC | -5.04% |
Open Interest and Funding Rates
Speculative positioning in SUI has intensified, marked by a substantial 39.05% increase in Open Interest over the past seven days, bringing the total to $0.121 billion. This figure significantly exceeds the 90-day Open Interest baseline of $0.079 billion, indicating a marked expansion in leveraged participation. The current funding rate is positive at 0.005046%, with a 7-day cumulative rate of 0.054990%, reflecting a sustained long bias among derivatives traders. Despite this, the 30-day funding Z-score remains near neutral at -0.0532. Liquidation data reveals that long positions accounted for $17.9 million (72.1%) of the total $24.8 million in liquidations over the past seven days, a pattern consistent with the 30-day average where long liquidations represent 74.8% of the total. While long-side liquidations are prominent, the overall 30-day directional skew is assessed as balanced, suggesting a dynamic interplay of positioning.

Metric | Value |
Funding Rate (current) | +0.0050% |
Funding Cumul. 7d | +0.0550% |
Open Interest | $0.12B (+39.05% 7d) |
Liq. 24h Longs | $0M |
Liq. 24h Shorts | $0M |
Liq. 7d Longs | $18M |
Liq. 7d Shorts | $7M |
Metric | Value |
Realized Vol 7d | +97.23% (90d avg: +66.58%) |
Realized Vol 30d | +79.75% |
Corr. BTC 30d | 0.8021 (90d avg: 0.8279) |
Beta vs BTC | 1.4440 |
Volume Momentum | 1.2760x |
Funding Z-Score 30d | -0.05σ |
Turnover Ratio | 0.2143 |
Liq. Intensity | 0.00732 |
Key Monitoring Conditions Ahead
Monitoring conditions for the upcoming week center on several key dynamics. First, the sustainability of SUI's recent price gains amidst elevated volatility will be crucial; a consolidation of current price levels would suggest a more robust underlying demand. Second, the trajectory of Open Interest, which saw a significant surge, will indicate whether leveraged participation continues to expand or begins to normalize, potentially signaling shifts in speculative conviction. Finally, the broader market environment, particularly the upcoming US macroeconomic data releases including Core PPI, PPI, and Unemployment Claims on September 10th, followed by Core CPI and CPI data on September 11th, could introduce external volatility. Given SUI's high correlation and beta to Bitcoin, these macro events may influence its price action and overall market sentiment.
Indicator | Value | Variation |
Broad Dollar Index | 118.75 | flat (7d) |
US 10Y Yield | 4.77% | +0.02pp (7d) |
Fed Balance Sheet | $6737B | +$6,292M (7d) |
M2 Money Supply | $23,218B | +$102.8B (1m) |
Fear & Greed | 71 (Greed) | +2 pts (7d) |
Fear & Greed Index: Alternative.me
Sui Weekly Takeaway
SUI concludes the week in a state of heightened activity and evolving positioning. The notable price appreciation has been accompanied by a significant expansion in leveraged exposure, pushing Open Interest well above its historical baseline. While the asset has demonstrated short-term outperformance against Bitcoin, its medium-term relative strength remains challenged, and its price dynamics continue to amplify broader market movements. The prevalence of long liquidations, despite a balanced overall directional skew, points to underlying positioning tension as leveraged participants navigate the increased volatility.
Disclaimer
This article provides a fundamental analysis of SUI's market dynamics based on available data and should not be considered investment advice or a recommendation to buy or sell any asset.


