SUI Breakout Analysis: Momentum Faces Key $0.96 Resistance

This SUI breakout analysis examines the current SUI/USDC structure in the context of support defense and weakening alternative frameworks. SUI/USDC has dramatically shifted its market structure, breaking out from a multi-week consolidation phase with significant force. The price has surged from lows around $0.64 to test the $0.95 weekly high, driven by a sharp increase in momentum and a developing trend, as indicated by a D1 RSI of 71.50 and a D1 ADX of 28.07. This explosive move resolves the period of subdued volatility and internal market tension described in last week's fundamental analysis, where expanding derivatives interest was constrained within a narrow price range. The current technical landscape is now defined by this powerful bullish impulse on the daily timeframe, which is currently consolidating after an initial rejection from major long-term resistance. The market's ability to absorb this selling pressure will be critical in determining the sustainability of the new upward trajectory.
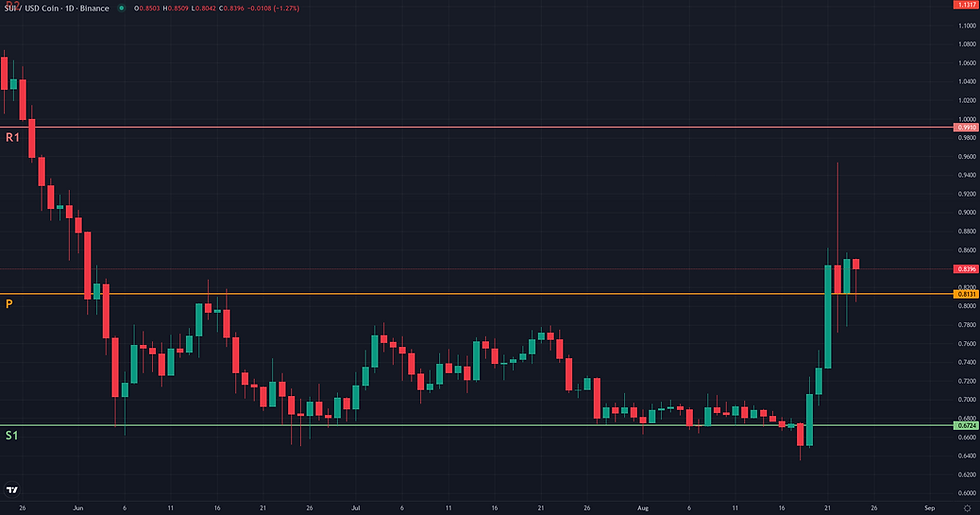
Range & Rebound: Market Structure Assessment
The Range/Rebound framework is assessed as not plausible for SUI/USDC at this time. While the market did execute a powerful rebound from a significant support zone established between 0.64 and 0.67 (coinciding with the W1 S1 pivot), the nature of this rebound has fundamentally altered the market structure. Instead of a controlled stabilization within a defined range, the price has entered a high-velocity breakout phase. This is evidenced by the D1 ADX rising to 28.07, signaling a new trend, and an extremely high Volume Oscillator at 96.27, which confirms strong conviction behind the move. The price has shattered the previous range ceiling around 0.72 and is now trading with a D1 RSI of 71.50, indicating a state of strong momentum rather than the gradual rebalancing sought by this framework. Consequently, the market is no longer range-bound but trending. For the Range/Rebound framework to become relevant again, the market would need to either see this breakout fail with a return below 0.72 or establish a new, higher-level consolidation area.
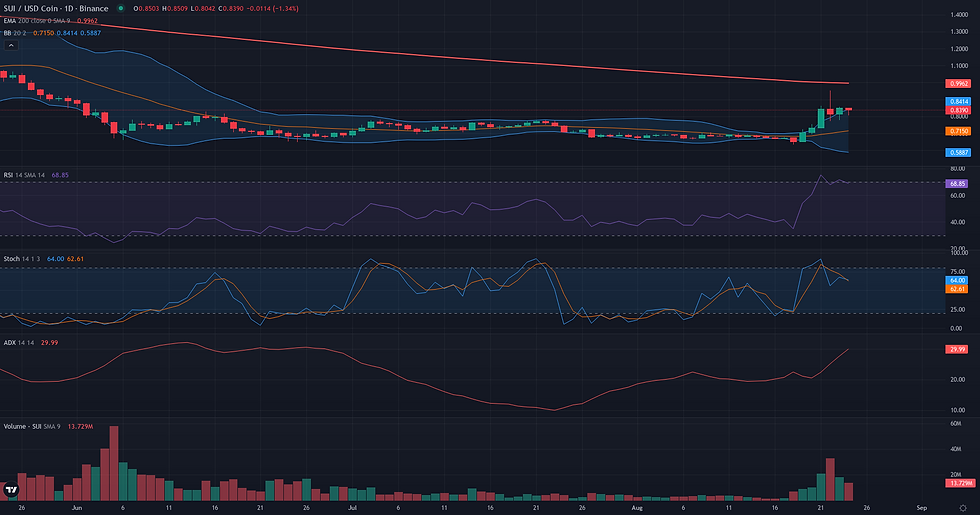
SUI Breakout Analysis: Structural Catalyst Assessment
The Breakout framework is technically plausible for SUI/USDC, driven by a dramatic shift in market structure on the daily timeframe. After nearly a month of low-volatility consolidation, the price has initiated a powerful upward expansion. This move is characterized by a sharp increase in momentum, with the D1 RSI reaching 71.50, and is validated by an exceptional surge in volume, as shown by the Volume Oscillator peaking at 96.27. This combination of range compression followed by a high-energy release is the core signature of a breakout in preparation. The focal point of this structure is the well-defined resistance zone between 0.95 (the recent high) and 0.96 (the D1 EMA 200). The price has already tested this critical barrier and experienced an initial rejection, which now sets the stage for a potential second attempt. However, this bullish daily setup faces significant friction from the weekly context. On the higher timeframe, the asset remains in a broader bearish structure, trading far below key moving averages like the W1 EMA 50 at 1.33, and the W1 RSI at 44.95 has not yet confirmed a shift to bullish momentum. The plausibility of the framework therefore rests on whether the demonstrated D1 strength can overcome the immediate 0.96 resistance and challenge the weaker weekly backdrop.

Continuation: Directional Flow Assessment
The technical structure for SUI/USDC presents a compelling but conflicted case for a bullish continuation, leading to a borderline verdict. On one hand, the asset has just executed a powerful breakout from a prolonged consolidation range, evidenced by a sequence of large-bodied daily candles starting August 19th. This impulsive move is strongly supported by a surge in volume (Volume Oscillator D1: 96.27) and a rising ADX (28.07), confirming a significant shift in market dynamics. The price has established a clear foothold above its D1 EMA50 (0.73), and the current pullback appears constructive, consolidating above the weekly pivot at 0.81. However, this short-term bullishness faces a formidable test. The rally was sharply halted at the 0.95 weekly high, a level that aligns closely with the major D1 EMA200 resistance at 0.96. This rejection suggests significant selling pressure. Furthermore, the broader weekly context is not yet supportive of a sustained uptrend, with price remaining well below key weekly moving averages and a W1 RSI (44.95) that is still in neutral territory. The current scenario is therefore a battle between a potent D1 impulse and major overhead structural resistance. A continuation is plausible but requires the price to absorb the recent rejection and decisively overcome the 0.95-0.96 resistance zone.
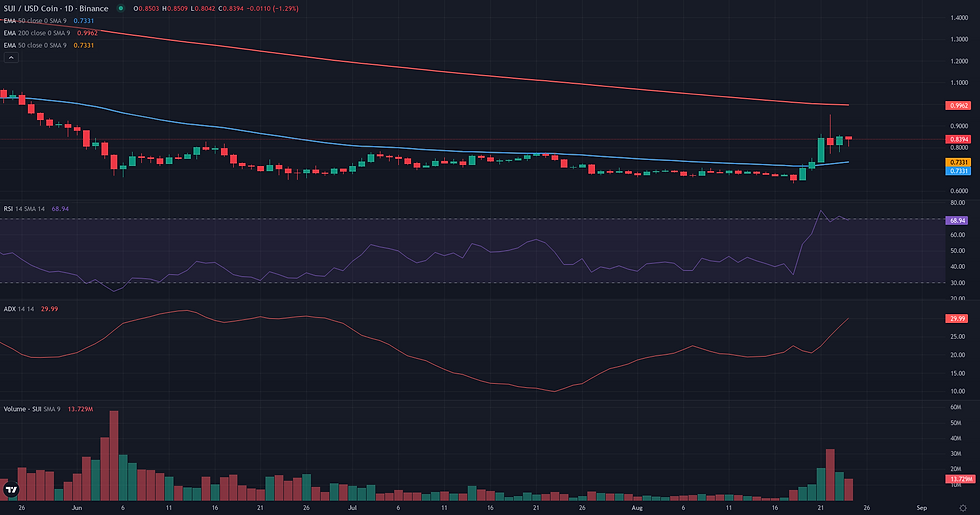
Comparative Framework Verdict
In the current market structure for SUI/USDC, the three technical frameworks present a clear hierarchy of relevance. The Breakout framework emerges as the most plausible, accurately capturing the recent high-volume, high-momentum rupture of the consolidation range that had capped the price for weeks. This framework correctly identifies the primary market event and focuses on the critical test of the overhead resistance zone between the recent $0.95 high and the D1 EMA 200 at $0.96. Following this, the Continuation framework is assessed as borderline. It addresses the immediate aftermath of the breakout: the current pullback and consolidation. While the underlying D1 impulse is strong, this framework acknowledges the significant friction from the rejection at $0.96 and the weaker, non-bullish weekly context, making a smooth continuation less certain. Finally, the Range/Rebound framework is deemed not plausible. Its core condition—a defined, stable range—was decisively invalidated by the recent explosive price action. The market is now clearly in a trending or post-trend consolidation phase, not a ranging one. The key technical question moving forward is whether the bullish daily momentum can overcome the significant weekly resistance to validate the breakout.
For broader market context, readers can also review the latest related fundamental analysis for this pair.
For live market monitoring and the full interactive chart, readers can access the dedicated SUI Market Hub.
Disclaimer
CopyTradia provides technical analysis for informational and educational purposes only. This content does not constitute financial advice, investment recommendations, or trading signals. Cryptocurrency markets are highly volatile. Past performance is not indicative of future results. Always conduct your own research (DYOR) and consult a qualified financial advisor before making any investment decisions.


