Sui Derivatives Landscape Shows Mixed Positioning

Sui has closed the week with notably subdued price action, characterized by a significant reduction in volatility compared to its historical average. This low volatility environment is accompanied by a nuanced picture in the Sui derivatives landscape, where increasing open interest and positive funding rates coexist with a predominance of long liquidations. The market is exhibiting internal tension as participation expands within a constrained price range.
Sui Price Action and Volatility
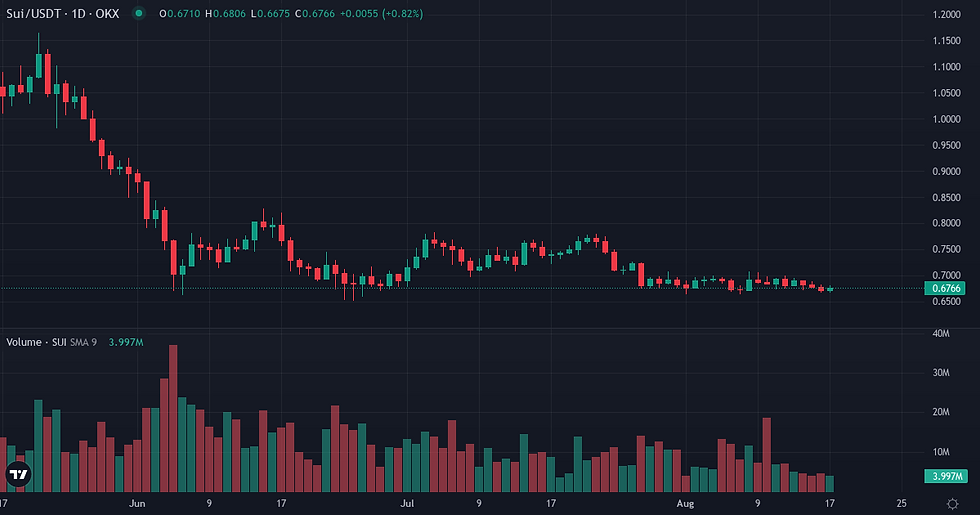
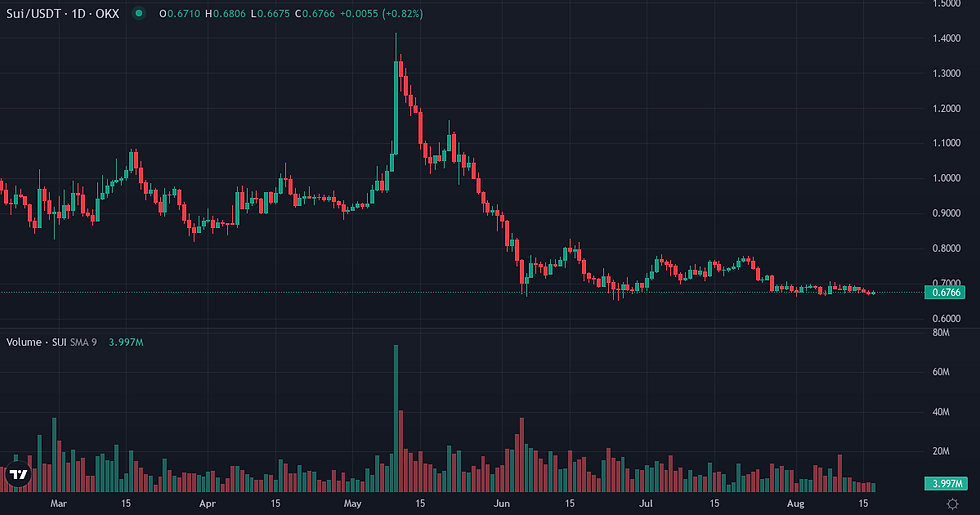
Sui's price action this week remained largely contained, registering a modest -2.70% decline over seven days, extending its 30-day downtrend of -7.60%. The asset currently trades at $0.68, maintaining a substantial 87.36% distance from its all-time high. A key characteristic of the current regime is the significantly reduced volatility, with the 7-day realized volatility at 23.56% and 30-day at 33.92%, both well below the 90-day baseline of 63.74%. This indicates a period of price compression and reduced kinetic energy. Against Bitcoin, Sui showed marginal outperformance over the past seven days with a +0.2294% relative gain, yet it has underperformed by -6.8720% over the last 30 days. The 30-day correlation with Bitcoin has also decreased to 0.6336 from its 90-day baseline of 0.8279, suggesting a degree of decoupling from broader market movements. Volume momentum is low at 0.473, further reinforcing the picture of reduced activity.
Metric | Value |
SUI Price | $0.68 (-0.20% 24h / -2.70% 7d / -7.60% 30d) |
Volume 24h | $99.2M |
Native Quote Vol. 24h | $2.4M |
Market Cap | $2.75B |
Market Cap Rank | 32 |
Circulating Supply | 4.07B SUI |
ATH Distance | 87.36% below ATH |
Metric | Value |
SUI/BTC Ratio | 0.00001100 |
Relative Perf. 7d vs BTC | +0.23% |
Relative Perf. 30d vs BTC | -6.87% |
Sui Derivatives Landscape Overview
The derivatives market for Sui presents a mixed but active picture. Open Interest has seen a 2.74% increase over the past seven days, bringing the total to $0.079B, aligning closely with its 90-day baseline. This suggests a modest expansion of leveraged participation. Funding rates remain positive, with the current rate at 0.008913% and a 7-day cumulative rate of 0.017507%, indicating a persistent long bias among derivatives traders. The 30-day funding Z-score of 1.2010 confirms that funding rates are elevated relative to their recent average. However, this long positioning has faced pressure, with long liquidations totaling $6.4M over the past seven days, accounting for 84.2% of all liquidations. While the 30-day average liquidation profile shows a more balanced directional skew, the recent concentration of long liquidations points to a specific unwinding of bullish bets within this low volatility environment.
Metric | Value |
Funding Rate (current) | +0.0089% |
Funding Cumul. 7d | +0.0175% |
Open Interest | $0.08B (+2.74% 7d) |
Liq. 24h Longs | $0M |
Liq. 24h Shorts | $0M |
Liq. 7d Longs | $6M |
Liq. 7d Shorts | $1M |
Metric | Value |
Realized Vol 7d | +23.56% (90d avg: +63.74%) |
Realized Vol 30d | +33.92% |
Corr. BTC 30d | 0.6336 (90d avg: 0.8279) |
Beta vs BTC | 1.0820 |
Volume Momentum | 0.4732x |
Funding Z-Score 30d | 1.20σ |
Turnover Ratio | 0.0360 |
Liq. Intensity | 0.00274 |
Key Market Dynamics to Monitor
Monitoring the persistence of the current low volatility regime will be crucial; a significant deviation from the 90-day baseline of 63.74% would signal a shift in market dynamics. The interaction between increasing Open Interest and continued long liquidations warrants close observation; a sustained increase in Open Interest without a corresponding reduction in long liquidations could indicate growing speculative tension. Furthermore, the upcoming macro events, including the FOMC Meeting Minutes on August 19th and the Philly Fed Manufacturing Index and Unemployment Claims on August 20th, could introduce external catalysts that interact with Sui's internal market structure, potentially influencing its correlation with Bitcoin, which has recently declined.
Indicator | Value | Variation |
Broad Dollar Index | 119.06 | flat (7d) |
US 10Y Yield | 4.63% | -0.09pp (7d) |
Fed Balance Sheet | $6760B | +$11,388M (7d) |
M2 Money Supply | $23,155B | +$99.6B (1m) |
Fear & Greed | 31 (Fear) | +2 pts (7d) |
Fear & Greed Index: Alternative.me
Sui Weekly Takeaway
Sui concludes the week in a state defined by significantly reduced volatility and a prevailing downtrend over the past month. While leveraged interest, as indicated by Open Interest, has expanded slightly, the market has also seen a notable concentration of long liquidations. This suggests that despite a general long bias in funding, speculative positioning is being actively challenged within the current constrained price environment. The asset's recent marginal outperformance against Bitcoin over seven days contrasts with its monthly underperformance, highlighting a lack of clear directional conviction. The overall picture is one of internal consolidation where the balance between expanding leverage and liquidation pressure remains a central dynamic.
Disclaimer
This article provides a fundamental analysis of Sui's market dynamics based on available data and should not be interpreted as investment advice or a recommendation to buy or sell any asset.


