SEI Breakout Analysis: Price Compresses at $0.08 Resistance

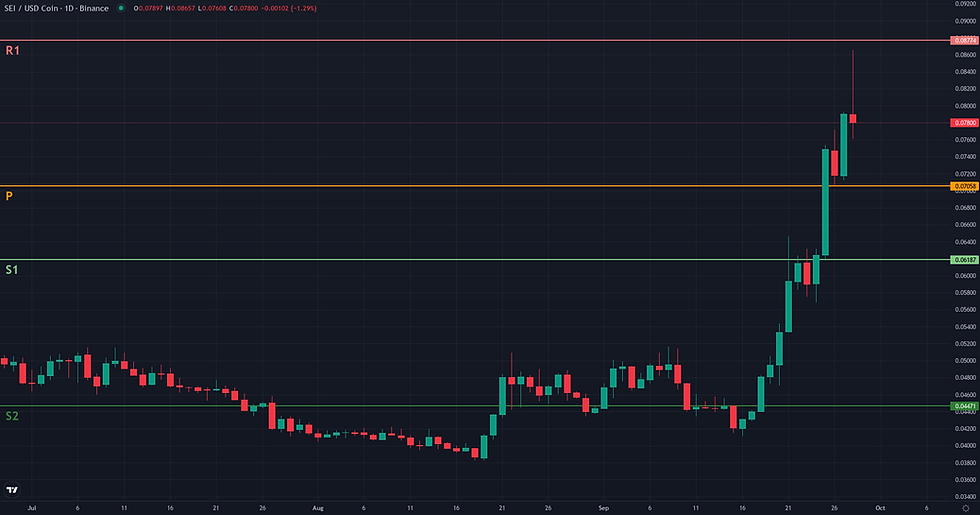
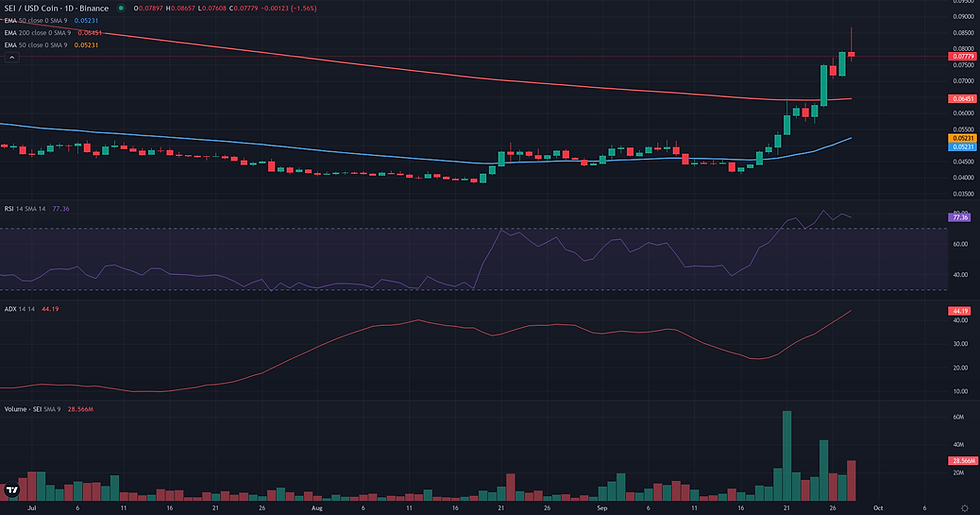
This SEI breakout analysis examines the current SEI/USDC structure in the context of support defense and weakening alternative frameworks. SEI/USDC is currently defined by a powerful bullish trend, with price action compressing against the key horizontal resistance at $0.08. The daily chart reflects a market with strong directional conviction, confirmed by an ADX reading of 41.60, well above the threshold for a strong trend. Momentum is equally pronounced, with the daily RSI at an overbought level of 79.09, indicating intense buying pressure that could also suggest short-term exhaustion. Price is trading at the high of its weekly range and significantly above key moving averages, reinforcing the dominant upward structure. This technical setup, characterized by strong directional momentum, aligns with recent market analysis highlighting an expansion in leveraged positioning and heightened volatility for SEI. The current consolidation sets the stage for evaluating three distinct technical frameworks: a potential range rebound, a structural breakout, or a trend continuation.
Range & Rebound: Market Structure Assessment
The Range/Rebound framework is currently not plausible for SEI/USDC. The market structure is characterized by a strong bullish breakout, which is fundamentally at odds with the stabilization and controlled reversal signature this framework seeks. Instead of a slowdown at a potential support, the daily chart shows powerful upward momentum, confirmed by an ADX of 41.60 indicating a strong trend. Key oscillators are in overbought territory, with the D1 RSI at 79.09 and Stochastics at 94.30, reflecting the intensity of the recent buying pressure. Structurally, the price at 0.08 is pushing against the upper D1 Bollinger Band, a sign of trend continuation rather than range containment. This move represents a decisive breakout from the multi-month consolidation range visible on the weekly chart. For the Range/Rebound framework to become relevant, the market would first need to experience a significant pullback and then demonstrate clear signs of stabilization and bearish momentum exhaustion within a newly defined support zone.

SEI Breakout Analysis: Structural Catalyst Assessment
The Breakout framework appears plausible for SEI/USDC, centered on a well-defined structural test at the 0.08 level. The daily chart shows a constructive pattern of compression where price, after a sharp rally, is now consolidating over multiple sessions directly against this ceiling. This level is technically significant, corresponding to the upper Donchian Channel (20-day high) and the upper Bollinger Band. The case for a potential structural break is reinforced by a powerful convergence of indicators: the ADX at 41.60 signals a very strong underlying trend, while the RSI at 79.09 confirms intense buying pressure. Furthermore, the positive Volume Oscillator (26.60) indicates that the recent upward move is supported by expanding volume. While the daily RSI's overbought reading introduces a note of caution regarding potential short-term exhaustion, the overall structure and momentum alignment on both daily and weekly timeframes (W1 ADX at 30.50) provide a coherent technical basis for considering a breakout scenario.

Continuation: Directional Flow Assessment
The technical structure for SEI/USDC presents a plausible continuation scenario, anchored by a powerful breakout on the daily timeframe. The market has established a strong directional flow, evidenced by an ADX of 41.60, which signals a robust and trending environment. This impulse has pushed the price well above its key daily moving averages (EMA 50 and 200) and the weekly pivot at 0.07, reconfiguring these levels as potential support. The momentum is confirmed by a high RSI of 79.09 and is supported by a positive volume oscillator. On the weekly chart, the recent price action marks a decisive break from a prolonged consolidation phase. However, two factors warrant caution. The daily RSI is in overbought territory, which could precede a consolidation or pullback. More structurally significant, the price is advancing towards the weekly EMA 50 at 0.10, a major long-term resistance level that could cap the current move. While these elements introduce potential friction, they do not invalidate the clear and dominant bullish structure on the daily chart, which remains the primary driver for the continuation framework's plausibility.
Comparative Framework Verdict
Comparing the three technical frameworks, the analysis points towards a clear dominance of directional scenarios over stabilization. The Breakout framework emerges as the most plausible, directly addressing the current price compression at the $0.08 resistance. Its validation hinges on a sustained daily close above this level, which would confirm the continuation of the strong underlying trend identified by the daily ADX of 41.60. A very close second is the Continuation framework, also rated as plausible. It focuses on the trend's resilience, suggesting that the bullish structure remains intact as long as the price holds above the weekly pivot point around $0.07. Both frameworks are supported by high momentum but are tempered by the overbought RSI reading, which introduces a note of caution. In stark contrast, the Range/Rebound framework is deemed not plausible. The market's strong directional momentum and overbought conditions are fundamentally incompatible with the stabilization and reversal signature required for a range-bound scenario. Consequently, the key element to monitor is the resolution of the current consolidation at the $0.08 level, which will either validate the breakout thesis or trigger a re-test of the support levels underpinning the continuation case.
For broader market context, readers can also review the latest related fundamental analysis for this pair.
For live market monitoring and the full interactive chart, readers can access the dedicated SEI Market Hub.
Disclaimer
CopyTradia provides technical analysis for informational and educational purposes only. This content does not constitute financial advice, investment recommendations, or trading signals. Cryptocurrency markets are highly volatile. Past performance is not indicative of future results. Always conduct your own research (DYOR) and consult a qualified financial advisor before making any investment decisions.


