Analyzing Sei Market Dynamics Amidst Elevated Volatility

Sei has demonstrated a regime of significant upward momentum this week, marked by substantial price appreciation and strong outperformance against Bitcoin. This movement is accompanied by a notable expansion in leveraged positioning and heightened volatility, suggesting a measurable inflection in its Sei market dynamics.
Sei Price Action and Volatility
Sei's spot price has advanced by 26.52% over the last seven days and 68.03% over the past month, indicating a sustained upward trajectory. This price action occurred within an environment of elevated realized volatility, which stood at 165.20% over the last seven days, significantly above its 90-day baseline of 79.15%. Against Bitcoin, Sei exhibited strong relative strength, outperforming BTC by 47.7395% weekly and 50.6242% monthly. While its 30-day correlation with Bitcoin is 0.6596, slightly above its 90-day baseline of 0.6325, and its Beta at 1.857 suggests amplification of BTC's moves, the substantial relative outperformance points to an autonomous impulse driving Sei's recent gains. Structurally, Sei remains 93.31% below its all-time high.
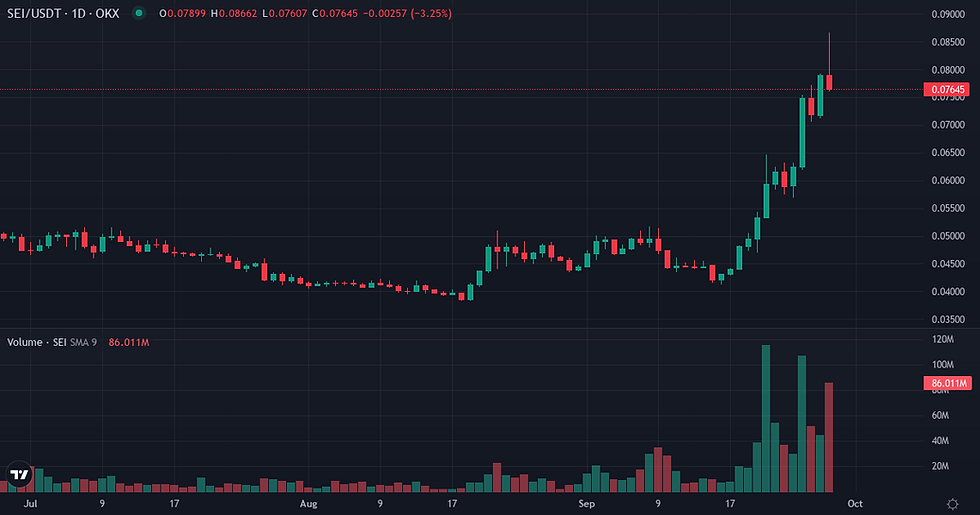
Metric | Value |
SEI Price | $0.08 (+4.49% 24h / +26.52% 7d / +68.03% 30d) |
Volume 24h | $229.1M |
Native Quote Vol. 24h | $2.7M |
Market Cap | $513.4M |
Market Cap Rank | 110 |
Circulating Supply | 6.73B SEI |
ATH Distance | 93.31% below ATH |
Metric | Value |
SEI/BTC Ratio | 0.00000100 |
Relative Perf. 7d vs BTC | +47.74% |
Relative Perf. 30d vs BTC | +50.62% |
Leveraged Positioning and Funding Rates
Leveraged participation in Sei has expanded notably, with Open Interest increasing by 33.62% over the past seven days to $0.019 billion, exceeding its 90-day baseline of $0.009 billion. This growth in open exposure is accompanied by a positive funding rate, with a 7-day cumulative rate of 0.070000% and a 30-day funding Z-score of 0.6637, indicating a bullish bias in derivatives positioning relative to recent averages. Liquidation data shows that long liquidations accounted for 71.3% ($2.1 million) of the total $2.9 million in liquidations over the past week, with the 30-day average also showing a lean towards long liquidations at 66.0%. Despite this, the overall 30-day directional skew remains balanced, suggesting that while some leveraged long positions were cleared during price fluctuations, the market has not developed an extreme directional bias from liquidations alone.
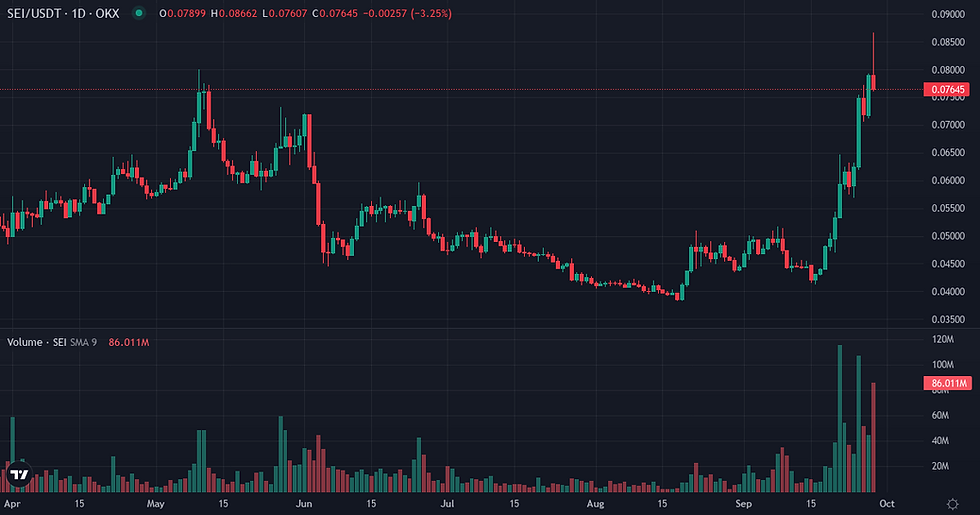
Metric | Value |
Funding Rate (current) | +0.0100% |
Funding Cumul. 7d | +0.0700% |
Open Interest | $0.02B (+33.62% 7d) |
Liq. 24h Longs | $0M |
Liq. 24h Shorts | $0M |
Liq. 7d Longs | $2M |
Liq. 7d Shorts | $1M |
Metric | Value |
Realized Vol 7d | +165.20% (90d avg: +79.15%) |
Realized Vol 30d | +111.60% |
Corr. BTC 30d | 0.6596 (90d avg: 0.6325) |
Beta vs BTC | 1.8570 |
Volume Momentum | 0.6477x |
Funding Z-Score 30d | 0.66σ |
Turnover Ratio | 0.4462 |
Liq. Intensity | 0.00576 |
Key Dynamics for Weekly Observation
Several dynamics warrant close observation in the coming week to assess the continuity or shift in Sei's current regime. The first is the interplay between price action and volatility; continued upward price movement sustained by elevated realized volatility would confirm the current high-momentum environment, whereas a significant reduction in volatility while price consolidates could signal a shift in the market's character. Secondly, the trajectory of Open Interest and funding rates will be crucial; a further expansion of Open Interest coupled with a rising funding Z-score would indicate increasing speculative conviction, while a contraction in Open Interest could suggest deleveraging. Finally, the upcoming macro schedule, featuring key economic indicators such as the ADP Non-Farm Employment Change, Core PCE Price Index, and the broader Non-Farm Employment Change, could introduce external market volatility. Significant deviations from consensus forecasts in these reports may influence broader market sentiment and potentially impact Sei's correlation and beta against Bitcoin, thereby affecting its autonomous price action.
Indicator | Value | Variation |
Broad Dollar Index | 119.51 | flat (7d) |
US 10Y Yield | 5.18% | +0.22pp (7d) |
Fed Balance Sheet | $6748B | +$1,156M (7d) |
M2 Money Supply | $23,343B | +$124.9B (1m) |
Fear & Greed | 74 (Greed) | -4 pts (7d) |
Fear & Greed Index: Alternative.me
Sei Weekly Takeaway
Sei concludes the week in a state of pronounced upward momentum, characterized by substantial price gains and significant outperformance relative to Bitcoin. This strong internal impulse is supported by an expanding derivatives market, evidenced by a notable increase in Open Interest and a positive funding bias, indicating growing leveraged participation. While volatility remains elevated, the overall market structure reflects a measurable inflection where autonomous demand for Sei is evident. The current regime is defined by this combination of strong price action, high volatility, and expanding speculative interest, positioning Sei as an asset with distinct internal dynamics.
Disclaimer
This analysis of Sei market dynamics is purely for informational purposes and provides a fundamental perspective on the asset's current state; it does not constitute investment advice or a recommendation to buy or sell any asset.


