SEI Breakout Analysis: Uptrend Pauses at 0.09 Resistance

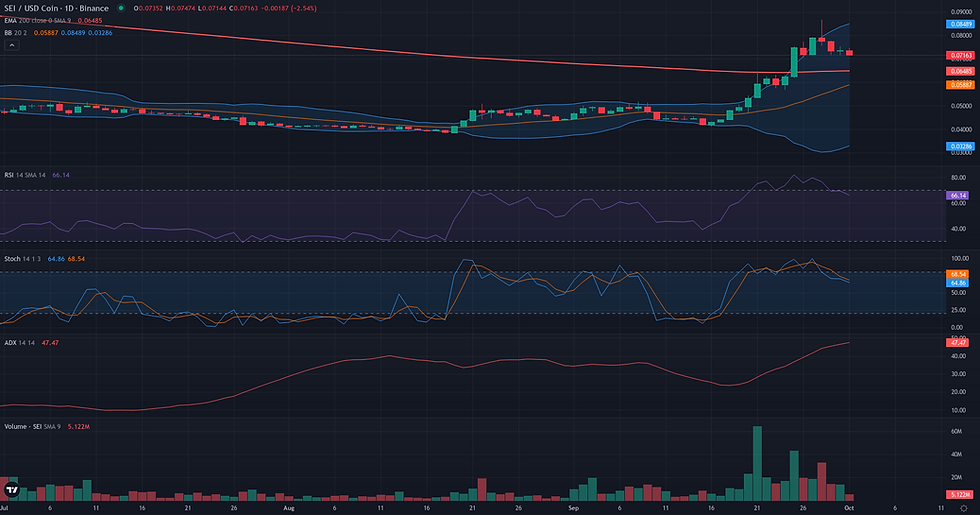
This SEI breakout analysis examines the current SEI/USDC structure in the context of support defense and weakening alternative frameworks. SEI/USDC is currently defined by a powerful bullish trend, a structure confirmed by a high daily ADX reading of 46.32. After a significant rally that pushed the price from lows near 0.05 to a weekly high of 0.08, the market has entered a phase of consolidation. Momentum remains strong, with the daily RSI at 69.06, indicating sustained buying pressure that is approaching overbought territory. This technical picture of a strong, directional move aligns with recent market analysis, which highlights an inflection point defined by significant upward momentum and heightened volatility. The price is now navigating the area between its immediate support around the 0.07 weekly pivot and the key resistance ceiling near 0.09. This consolidation sets the stage for the key question of the week: is this a temporary pause before another upward thrust, or the beginning of a deeper correction?

Range & Rebound: Market Structure Assessment
The Range/Rebound framework is assessed as not plausible for SEI/USDC at this time. The current market structure is characterized by a strong, directional uptrend, which is fundamentally misaligned with the framework's objective of identifying stabilization at a support level. The ADX on the daily chart, with a high reading of 46.32, confirms the presence of a powerful trend, leaving no room for a range-based interpretation. The price has already broken out decisively from a month-long consolidation base between 0.04 and 0.05, and momentum indicators such as the RSI (69.06) and Stochastic are now in overbought territory, signaling that the upward move is mature rather than nascent. This context is more suited to a trend-following or breakout analysis than a search for a controlled reversal from a low. For the Range/Rebound framework to become relevant, the market would first need to undergo a significant correction, followed by a period of stabilization and momentum deceleration at a well-defined support structure, such as the 0.06 area.
SEI Breakout Analysis: Structural Catalyst Assessment
The current market structure presents a plausible breakout scenario. A powerful rally throughout September has brought the price to a significant resistance ceiling around the 0.09 mark. This level's importance is reinforced by a confluence of technical indicators, namely the Donchian 20 D1 upper band and the W1 R1 pivot point, both situated at 0.09. The underlying dynamic strongly supports the potential for a structural break; the daily ADX at 46.32 signals an exceptionally strong trend, while the RSI at 69.06 indicates robust buying momentum that is not yet in overbought territory. Furthermore, the positive Volume Oscillator (5.70) and notable volume spikes on bullish days suggest that the upward move is well-supported. The primary element tempering this reading is the minor pullback observed over the last two sessions, which introduces a slight ambiguity as to whether this is a consolidation phase or an initial rejection. However, given the overwhelming strength of the underlying trend and momentum, the structure is currently interpreted as a pause before a potential continuation, aligning well with the Breakout framework.

Continuation: Directional Flow Assessment
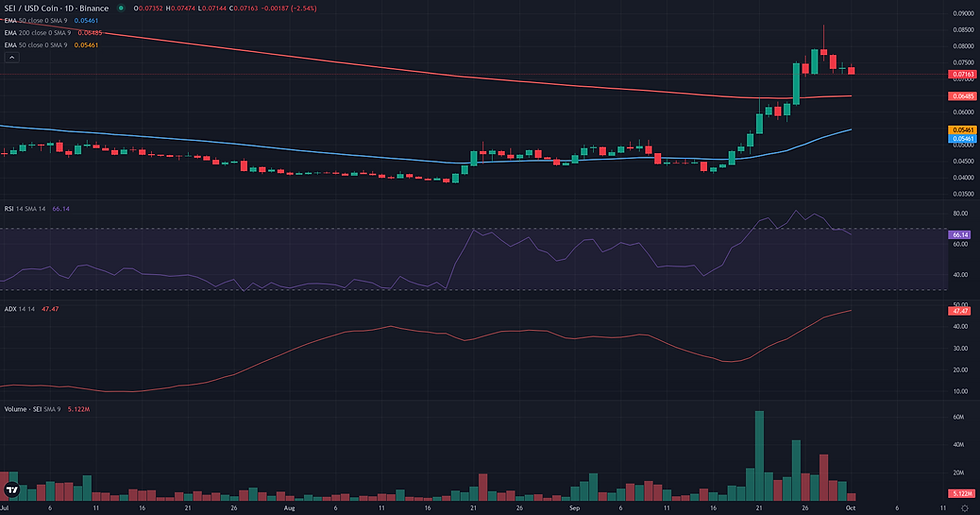
The technical structure for SEI/USDC presents a plausible continuation scenario. The primary driver for this reading is the recent powerful bullish impulse on the daily chart, which broke out of a prolonged consolidation phase. This move is supported by strong, trend-confirming momentum, with the D1 ADX at a high value of 46.32. The price has successfully cleared and is currently holding above key daily moving averages, including the D1 EMA 200 at 0.06. Following the peak at 0.09, the market has entered a pullback phase, which appears constructive as it finds support around the Weekly Pivot at 0.07. This price action is characteristic of a healthy trend, where momentum cools before a potential subsequent leg. The weekly context reinforces this view with a recent, decisive breakout candle. However, a note of caution is warranted as the price is still trading well below the long-term W1 EMA 50 (0.10), which could represent a significant area of future resistance.
Comparative Framework Verdict
Comparing the three technical frameworks, two plausible bullish scenarios emerge while the third is clearly invalidated. The Range/Rebound framework is deemed not plausible, as the market’s powerful directional trend (ADX at 46.32) is fundamentally at odds with the range-bound conditions this strategy requires. The primary debate is between the Breakout and Continuation frameworks, both of which are assessed as plausible. The Breakout framework presents the most immediate and specific scenario, focusing on the price compressing against a well-defined resistance ceiling at 0.09. A sustained move above this level would signal a direct continuation of the uptrend. The Continuation framework offers a broader perspective, interpreting the current price action as a healthy pullback that remains valid as long as it holds above structural support, primarily the 0.06 zone. While both frameworks are coherent, the Breakout scenario is considered dominant because it addresses the most critical, immediate test for the market. The Continuation framework serves as a strong secondary context, defining the floor for the current bullish structure. Moving forward, the key elements to monitor will be the market's reaction to the 0.09 resistance and its ability to maintain support above 0.06.
For broader market context, readers can also review the latest related fundamental analysis for this pair.
For live market monitoring and the full interactive chart, readers can access the dedicated SEI Market Hub.
Disclaimer
CopyTradia provides technical analysis for informational and educational purposes only. This content does not constitute financial advice, investment recommendations, or trading signals. Cryptocurrency markets are highly volatile. Past performance is not indicative of future results. Always conduct your own research (DYOR) and consult a qualified financial advisor before making any investment decisions.


