SEI Breakout Analysis: Consolidation Break Faces Headwinds

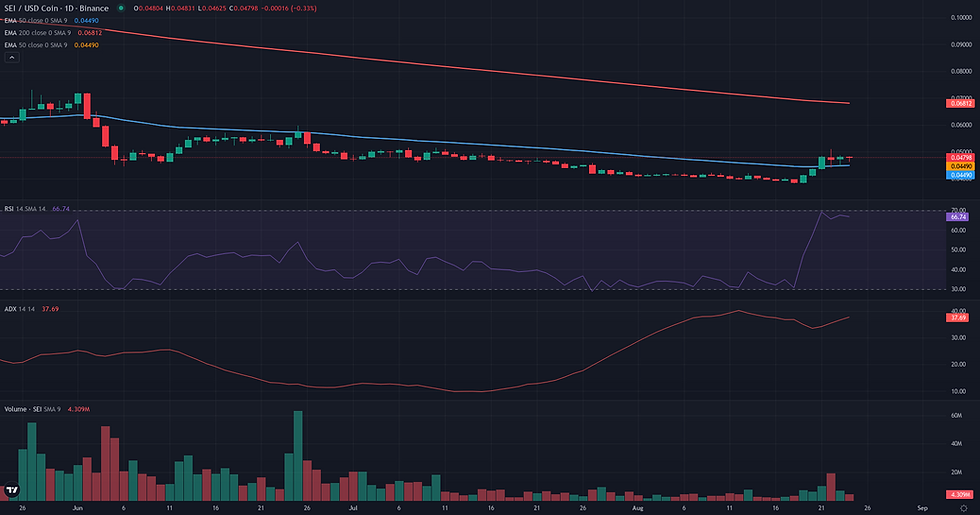
This SEI breakout analysis examines the current SEI/USDC structure in the context of support defense and weakening alternative frameworks. SEI/USDC has undergone a significant structural shift, breaking out of a month-long, low-volatility consolidation range between 0.04 and 0.05. The daily chart reflects this change with strengthening directional momentum, as indicated by an ADX of 35.29 and an RSI of 67.49. Price is currently holding above the 50-day EMA, a classic sign of short-term bullish control, but remains well below the key 200-day EMA at 0.07, highlighting the broader bearish context. This technical breakout, characterized by recently increased volatility, aligns with fundamental observations of expanding leveraged exposure in the derivatives market. The current price action at the 0.05 pivot is therefore critical, representing a test of this newfound momentum against the backdrop of a persistent long-term downtrend. The following analysis will explore three technical frameworks—Range/Rebound, Breakout, and Continuation—to evaluate the potential resolutions of this market structure.
Range & Rebound Resolution: Support and Friction Zones
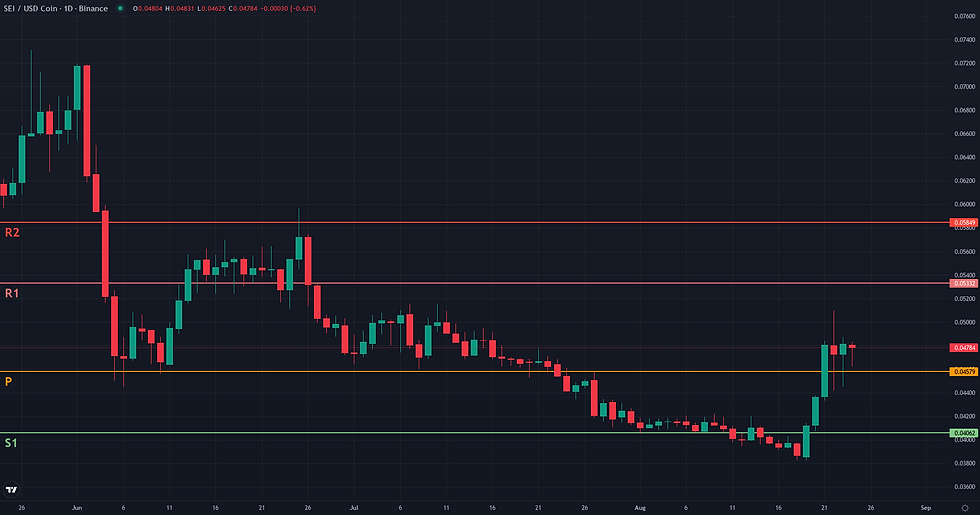
The resolution of the SEI/USDC Range/Rebound framework is centered on the market's reaction to the 0.05 pivot. As established in the entry phase, a sustained hold above this level is required to validate the rebound. The current 4H price action shows a consolidation at this critical juncture, effectively testing the breakout from the previous 0.04 support base. The framework would lose its coherence if this test fails. The invalidation zone is defined by a daily close below 0.04, a move that would not only negate the recent breakout but also breach the multi-week support and the D1 EMA 50, signaling a definitive failure of the rebound attempt. Should the framework confirm, its path is not without obstacles. An initial friction zone is located at 0.06, a level marked by the W1 R2 pivot and historical price interaction. Overcoming this resistance would be a key step in confirming bullish continuation. The primary projection zone for a successful rebound lies at the 0.07 level, which corresponds to the D1 EMA 200, representing a significant structural ceiling. Confirmation of the rebound's strength would involve a decisive move away from the 0.05 consolidation with renewed volume. Conversely, the framework would weaken if price begins to close below 0.05 on an intraday (4H) basis, especially with persistently low volume, indicating an inability to sustain the upward momentum.
SEI Breakout Analysis: Structural Catalyst Assessment
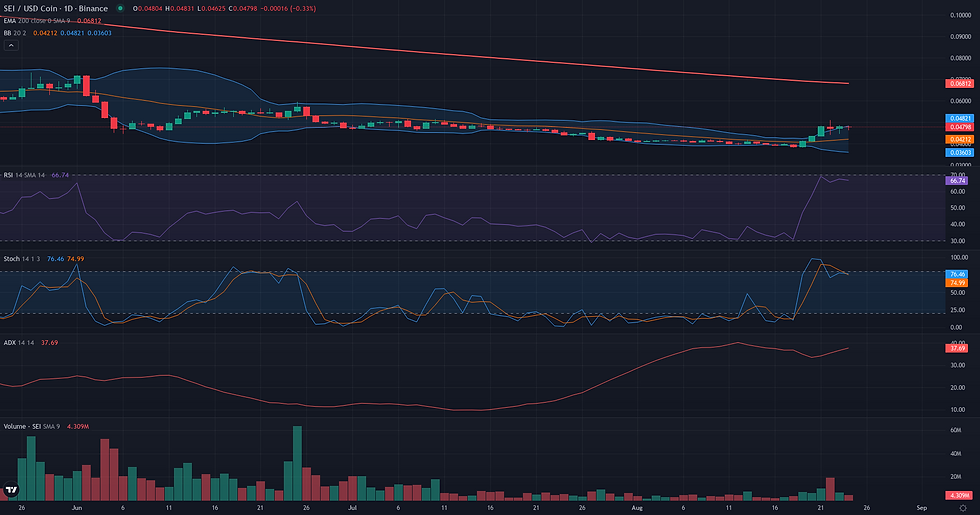
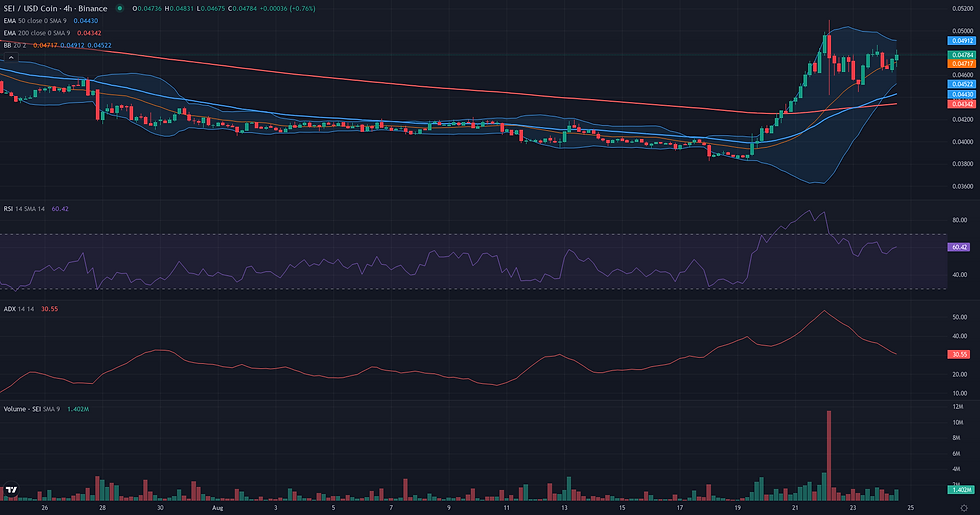
The Breakout framework is considered plausible for SEI/USDC due to an exceptionally clear technical structure on the daily chart. For nearly a month, the price has been locked in an extremely tight consolidation range between 0.04 and 0.05, leading to a significant compression of volatility. The recent price action shows a deliberate test of the 0.05 resistance ceiling, a level reinforced by multiple indicators including the upper Bollinger Band and the weekly R1 pivot. This move is supported by a notable expansion in volume and strengthening momentum, with the D1 RSI at 67.49 and ADX at 35.29, suggesting a directional trend is forming. However, this bullish D1 setup is unfolding within a strongly bearish weekly context. Price remains significantly below major weekly moving averages, and the weekly RSI (38.51) has yet to confirm a momentum shift. Therefore, while the D1 structure presents a textbook breakout candidate, any upward resolution would constitute a counter-trend move facing considerable overhead resistance, starting with the D1 EMA200 at 0.07.
Continuation: Directional Flow Assessment
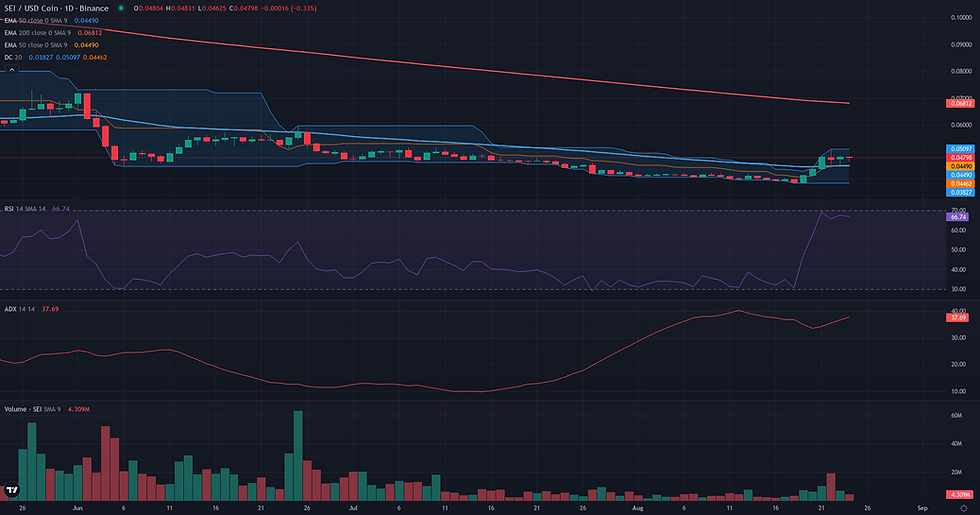
The Continuation framework appears plausible for SEI/USDC, centered on a distinct structural breakout on the daily timeframe. After nearly a month of tight consolidation around the 0.04 level, the price has initiated a clear upward move, establishing a new local high at 0.05. This directional impulse is technically well-supported. The ADX on the daily chart has risen to 35.29, signaling an emerging and strengthening trend. Concurrently, the D1 RSI at 67.49 reflects robust buying pressure without being immediately overextended, while the Volume Oscillator (49.03) confirms that the breakout was accompanied by a significant increase in market participation. The price is now trading above its D1 EMA50 (0.04), which has effectively served as a floor for the entire basing period. While this daily structure is constructive, it must be viewed within its weekly context. The asset remains in a long-term downtrend, trading well below its weekly moving averages. However, the recent D1 breakout can be interpreted as the start of a significant counter-move or potential trend reversal from a weekly low. The primary risk is the overhead resistance from the D1 EMA200 at 0.07, but the immediate structure supports the potential for continued upward momentum.
Comparative Framework Verdict
Comparing the three frameworks, the Breakout and Continuation scenarios present the most plausible interpretations of the current SEI technical analysis. The Breakout framework is considered dominant due to its clear description of the primary market event: a textbook structural break from a month of extreme price compression, supported by expanding volume and strengthening daily momentum. The Continuation framework is a close secondary, also rated plausible, as it accurately describes the current market state as an extension of that initial breakout impulse. These two frameworks are closely linked, essentially describing the cause and effect of the same directional move. The Range/Rebound framework is the weakest of the three, rated borderline. While it correctly identifies the bounce from the weekly support at 0.04, its utility as an entry-focused framework is diminished. The agent notes that the impulsive move has already pushed daily indicators into overbought territory, suggesting the low-risk entry window has passed. The framework now serves more as a validation of the breakout rather than a distinct scenario in itself. The key challenge for both the Breakout and Continuation frameworks is the prevailing bearish weekly context. For the current bullish structure to be sustained, the price must maintain its position above the 0.05 breakout point and eventually challenge the significant overhead resistance near the 200-day EMA at 0.07.
For broader market context, readers can also review the latest related fundamental analysis for this pair.
For live market monitoring and the full interactive chart, readers can access the dedicated SEI Market Hub.
Disclaimer
CopyTradia provides technical analysis for informational and educational purposes only. This content does not constitute financial advice, investment recommendations, or trading signals. Cryptocurrency markets are highly volatile. Past performance is not indicative of future results. Always conduct your own research (DYOR) and consult a qualified financial advisor before making any investment decisions.


