Sei Positioning Shows Expanding Leverage Amidst Price Gains

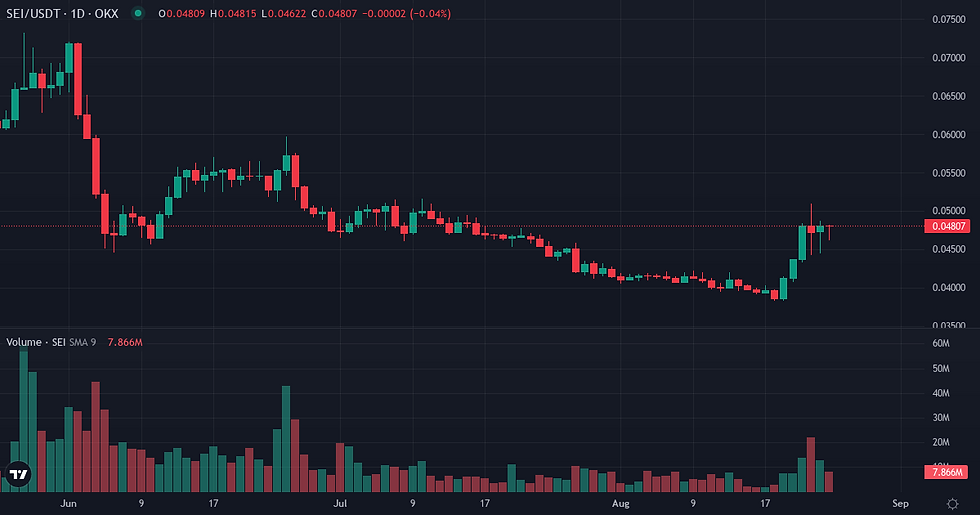
Sei concluded the week with a notable positive price movement, yet this occurred alongside underperformance relative to Bitcoin, indicating a market state primarily influenced by broader crypto trends. Volatility has recently increased, while derivatives positioning shows an expansion of leveraged exposure.
Sei Price Action and Volatility
Sei recorded a 19.50% gain over the last seven days, with a 30-day increase of 8.70%, bringing its spot price to $0.05. This recent upward movement contrasts with its long-term position, remaining 95.79% below its all-time high. The 7-day realized volatility at 84.56% is above its 90-day baseline of 74.36%, indicating a recent acceleration in price swings. Despite these absolute gains, Sei underperformed Bitcoin by 2.49% over the past week and 12.84% over the past month. Its 30-day correlation with Bitcoin stands at 0.7396, above the 90-day baseline of 0.6005, with a Beta of 1.054, suggesting its movements are strongly linked to and slightly amplified by Bitcoin's trajectory.
Metric | Value |
SEI Price | $0.05 (+1.54% 24h / +19.50% 7d / +8.70% 30d) |
Volume 24h | $38.3M |
Native Quote Vol. 24h | $522,251 |
Market Cap | $323.2M |
Market Cap Rank | 129 |
Circulating Supply | 6.73B SEI |
ATH Distance | 95.79% below ATH |
Metric | Value |
SEI/BTC Ratio | 0.00000100 |
Relative Perf. 7d vs BTC | -2.49% |
Relative Perf. 30d vs BTC | -12.84% |
Derivatives Positioning and Funding Rates
Open Interest for Sei increased by 13.03% over the past seven days, reaching $0.008B, which is still below its 90-day baseline of $0.009B. This indicates an expansion of leveraged participation, though not yet exceeding longer-term norms. The current funding rate is 0.010000%, with a 7-day cumulative rate of 0.066345%. The 30-day funding Z-score of 0.9822 suggests funding rates are significantly above their 30-day average, indicating a strong positive bias in leveraged positioning. Long liquidations dominated over the past week, accounting for 89.0% ($1.1M) of total liquidations, consistent with the 30-day average of 84.6% long liquidations. The overall liquidation profile shows a balanced directional skew over the 30-day average, despite the recent long dominance.

Metric | Value |
Funding Rate (current) | +0.0100% |
Funding Cumul. 7d | +0.0663% |
Open Interest | $0.01B (+13.03% 7d) |
Liq. 24h Longs | $0M |
Liq. 24h Shorts | $0M |
Liq. 7d Longs | $1M |
Liq. 7d Shorts | $0M |
Metric | Value |
Realized Vol 7d | +84.56% (90d avg: +74.36%) |
Realized Vol 30d | +53.91% |
Corr. BTC 30d | 0.7396 (90d avg: 0.6005) |
Beta vs BTC | 1.0540 |
Volume Momentum | 1.2660x |
Funding Z-Score 30d | 0.98σ |
Turnover Ratio | 0.1184 |
Liq. Intensity | 0.00386 |
Key Dynamics to Monitor
Several dynamics warrant monitoring in the coming week. The first is Sei's relative performance against Bitcoin; a sustained shift from underperformance to outperformance would signal a potential increase in autonomous strength, while continued underperformance would suggest ongoing reliance on broader market movements. Secondly, the trajectory of Open Interest and funding rates will be crucial; a sustained increase in Open Interest above its 90-day baseline, coupled with persistently high funding, would confirm conviction in the current upward trend, whereas a contraction in OI or a normalization of funding could signal a shift in speculative sentiment. Finally, upcoming macro data, including the Core PCE Price Index, Prelim GDP figures, and Unemployment Claims later in the week, could introduce broader market volatility, and given Sei's amplified correlation with Bitcoin, any significant reaction in the broader crypto market to these releases could influence its price action.
Indicator | Value | Variation |
Broad Dollar Index | 118.90 | flat (7d) |
US 10Y Yield | 4.69% | -0.03pp (7d) |
Fed Balance Sheet | $6746B | -$14,256M (7d) |
M2 Money Supply | $23,155B | +$99.6B (1m) |
Fear & Greed | 73 (Greed) | +32 pts (7d) |
Fear & Greed Index: Alternative.me
Sei Weekly Takeaway
Sei concluded the week with notable absolute price appreciation, yet this upward movement was primarily correlated with the broader market rather than driven by autonomous strength, as evidenced by its underperformance against Bitcoin. The expansion of leveraged positioning, marked by rising Open Interest and elevated funding rates, suggests a speculative bid that has not yet pushed the asset above its longer-term derivatives exposure norms. The asset remains significantly off its all-time high, indicating a structural recovery phase where current dynamics are still developing within a broader context of capital rotation.
Disclaimer
This analysis of Sei's market dynamics is purely for informational purposes and should not be construed as investment advice or a recommendation to buy or sell any asset.


