NEAR Range Rebound Analysis: Support Holds, Trend Fades

This NEAR range rebound analysis examines the current NEAR/USDC structure in the context of support defense and weakening alternative frameworks. NEAR/USDC is currently navigating a period of pronounced consolidation, with price action confined to a well-defined range over the past several weeks. The latest daily close at 1.87 USDC places the asset in a state of technical indecision, caught between key support at the D1 EMA 200 (1.81) and overhead resistance from the D1 EMA 50 (1.96). This lack of directional conviction is quantitatively confirmed by an extremely low D1 ADX reading of 10.25, which signals a non-trending market environment. Daily momentum, as measured by the RSI at 44.03, remains neutral-to-weak, failing to provide a clear bias. This technical picture of indecision aligns with recent fundamental observations of constrained price movement and contracting volatility, suggesting the market is awaiting a new catalyst. The current structure therefore lends itself to analyzing scenarios based on range mechanics rather than directional momentum.
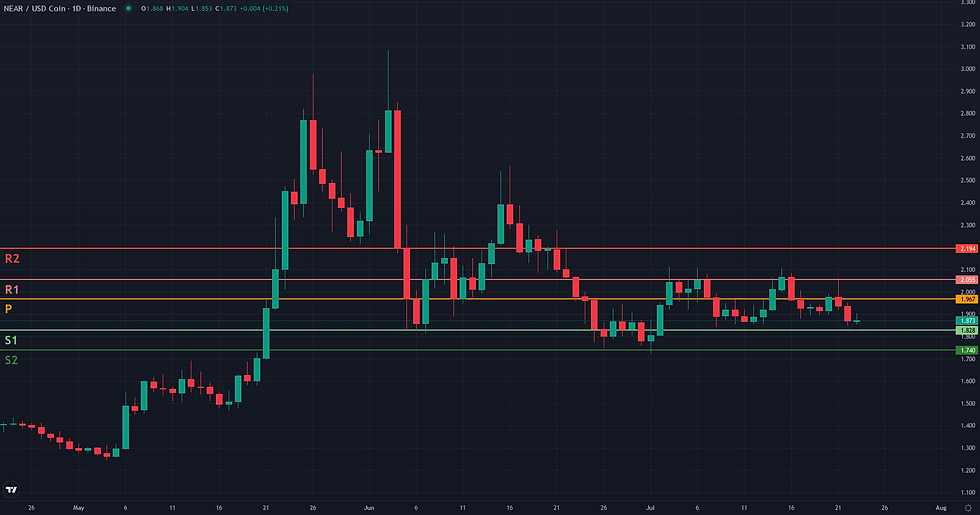
NEAR Range Rebound Analysis: Support and Friction Zones
For the NEAR/USDC pair, the Range/Rebound framework's resolution depends on the market's reaction to the critical support zone between 1.75 and 1.83 USDC. This area, anchored by the D1 EMA 200 and key weekly pivots, serves as the foundation for a potential rebound. The framework would lose its structural coherence if the price were to break down with a daily close below 1.72 USDC, the absolute low of the current 60-day range. This event would signal a failure of the established support and invalidate the ranging thesis. Should the rebound attempt materialize, its path is not without obstacles. The primary friction zone lies at the 1.96 - 1.97 USDC level. This area represents a confluence of the D1 EMA 50 and the Weekly Pivot, effectively acting as the range's equilibrium point. A decisive move above this zone would serve as a key confirmation, suggesting that buyers are taking control and aiming for higher levels within the range. Beyond this, a secondary resistance area is located around the W1 R1 pivot at 2.05 USDC. A successful and confirmed rebound would initially project towards the 2.19 USDC level, which corresponds to the W1 R2 pivot and previous resistance from mid-June. A more extended move could see a retest of the broader range highs near 2.56 USDC. On the other hand, a weakening of the framework would become apparent if the price repeatedly fails to sustain any bounce above 1.83 USDC, indicating that the support is absorbing selling pressure but not generating a strong enough reaction for a meaningful recovery.
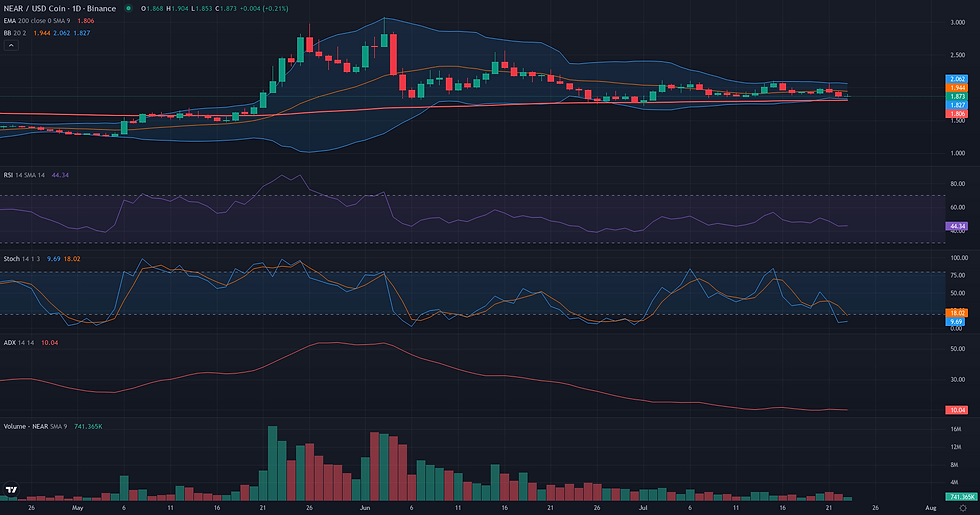

Breakout: Structural Catalyst Assessment
The Breakout framework is currently not plausible for NEAR/USDC. While the market has established a clear and significant horizontal resistance at the 2.11 USDC level, which has been tested multiple times in July, the recent price action does not suggest a preparatory phase for a structural break. Instead of consolidating tightly beneath this ceiling, the price has been decisively rejected, falling to the lower part of its recent range and trading below key moving averages such as the D1 EMA50 at 1.96 USDC. This structural weakness is compounded by a lack of bullish momentum; the D1 RSI stands at 44.03, indicating bearish control, while the D1 ADX at an extremely low 10.25 signals a complete absence of directional energy. For this framework to become relevant, the market would first need to reclaim key short-term levels and then build a sustained compression phase directly against the 2.11 resistance, accompanied by a clear shift in momentum.
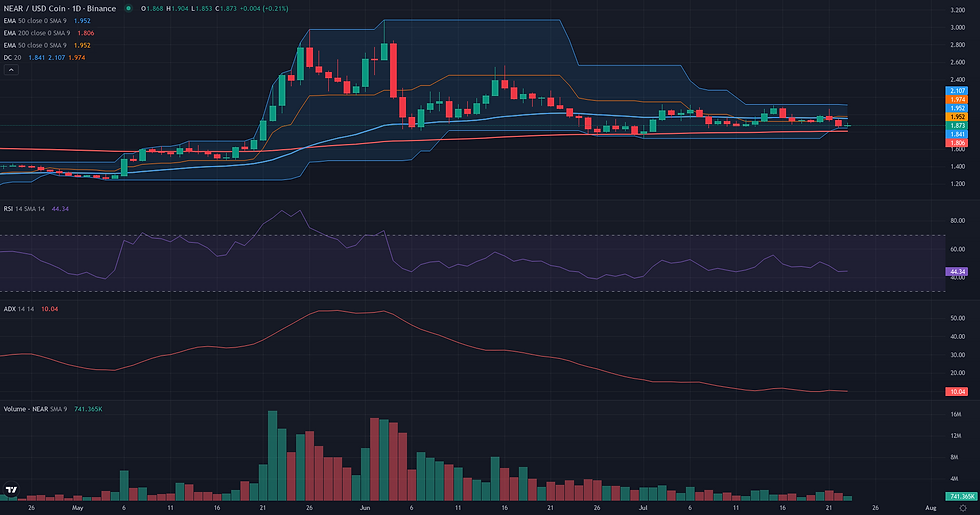
Continuation: Directional Flow Assessment
The Continuation framework is assessed as not plausible for NEAR/USDC at this time due to a clear absence of a directional trend. The market structure is characterized by a multi-week consolidation phase, which directly contradicts the 'Stable Directional Flow' signature required by this framework. The most compelling piece of evidence is the D1 ADX indicator, which registers an extremely low value of 10.25, quantitatively confirming a non-trending or range-bound market. This reading is visually supported by the daily price action, which has been oscillating within a defined range for the past month. Furthermore, the weekly context shows that the prior bullish impulse has stalled, with price now trading below the W1 EMA50 at 2.04, a level that may now act as overhead resistance. The neutral D1 RSI (44.03) and negative Volume Oscillator (-16.52) reinforce this view of market indecision and lack of directional conviction. For this framework to become relevant, the market would first need to establish a new directional impulse, likely signaled by a breakout from the current range accompanied by a significant rise in the ADX.
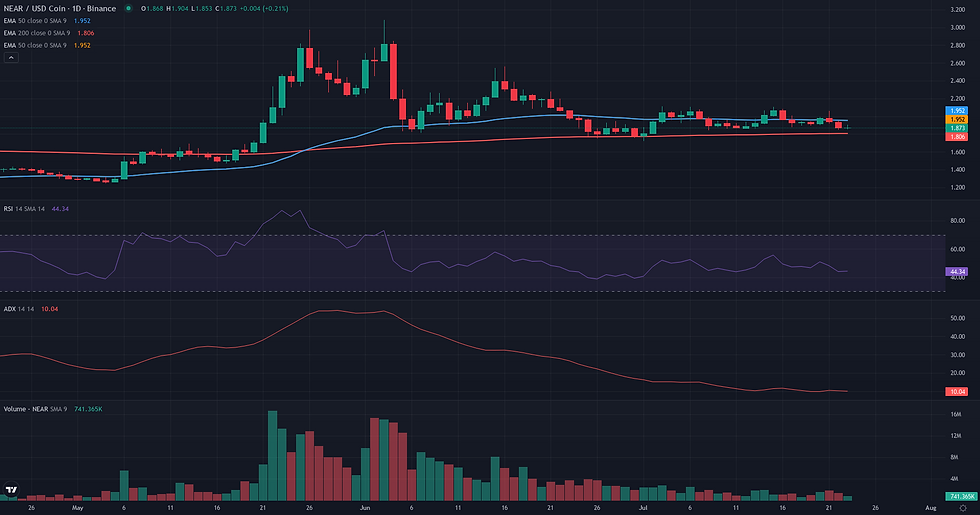
Comparative Framework Verdict
Comparing the three technical frameworks, the Range/Rebound scenario emerges as the only plausible structure for NEAR/USDC. Its validity is strongly anchored in the market's current non-trending state, confirmed by a D1 ADX of just 10.25 and a clear price channel established over the past month. This framework identifies a critical support zone between 1.75 and 1.83 USDC, a confluence of the D1 EMA 200 and weekly pivots, as the potential base for a bullish rotation within the range. In stark contrast, both the Breakout and Continuation frameworks are deemed not plausible. Their core requirement is directional energy and momentum, both of which are conspicuously absent from the current market structure. Any attempt to apply a trend-following or breakout logic is fundamentally contradicted by the prevailing conditions of consolidation and indecision. The resolution of the dominant Range/Rebound framework now hinges on the defense of its support zone. A failure, marked by a daily close below the 1.72 USDC low, would invalidate the structure. Conversely, a successful rebound would first need to overcome significant friction around the 1.96-1.97 USDC equilibrium before targeting higher levels within the established range.
For broader market context, readers can also review the latest related fundamental analysis for this pair.
For live market monitoring and the full interactive chart, readers can access the dedicated NEAR Market Hub.
Disclaimer
CopyTradia provides technical analysis for informational and educational purposes only. This content does not constitute financial advice, investment recommendations, or trading signals. Cryptocurrency markets are highly volatile. Past performance is not indicative of future results. Always conduct your own research (DYOR) and consult a qualified financial advisor before making any investment decisions.


