NEAR Protocol Stability Amidst Contracting Volatility

NEAR Protocol experienced a week characterized by constrained price movement and reduced volatility, with its relative position against Bitcoin holding steady. The market's internal dynamics show a contraction in leveraged participation, even as the broader crypto sentiment improved slightly.
NEAR Protocol Price and Volatility
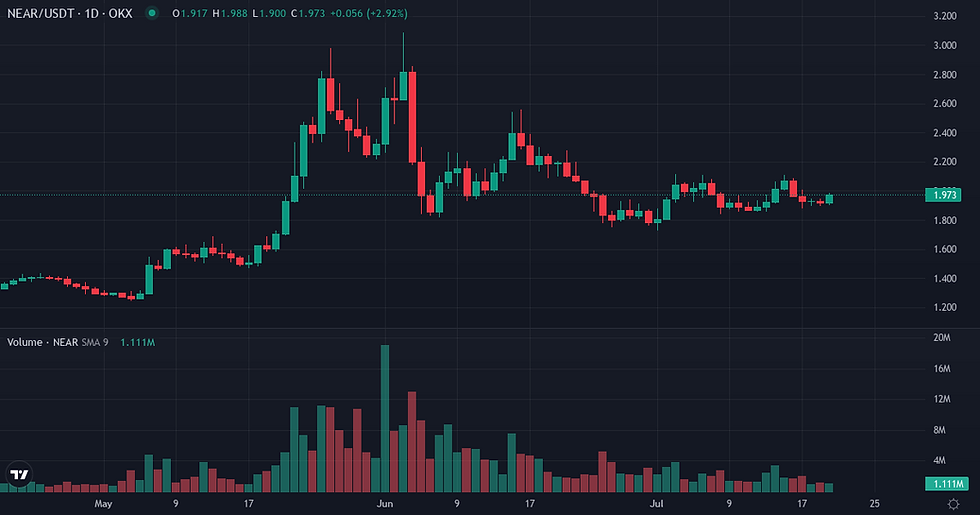
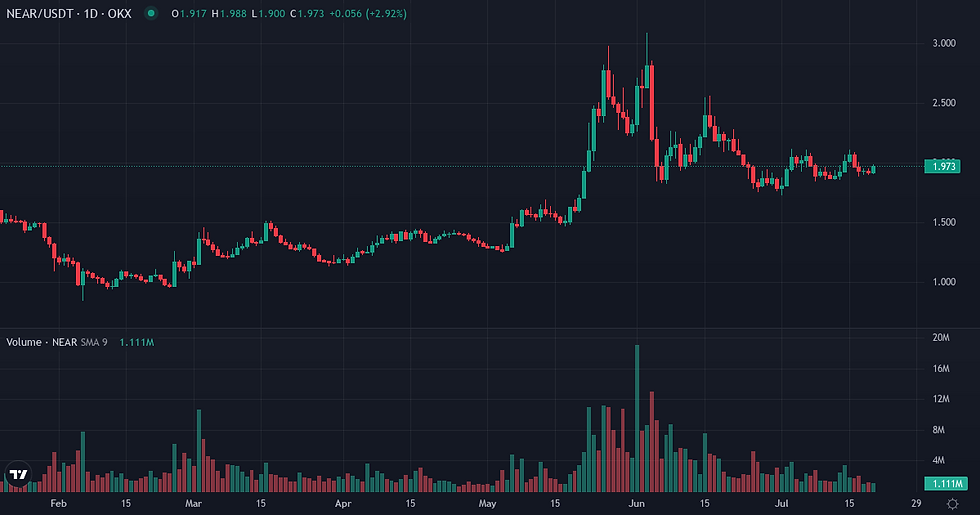
NEAR Protocol's price action this week showed limited movement, recording a modest 1.01% gain over seven days, following an 8.40% decline over the past month. The asset's spot price settled at $1.97. The realized volatility over seven days stood at 73.85%, significantly below its 90-day baseline of 126.20%, indicating a period of reduced price amplitude. Against Bitcoin, the NEAR/BTC ratio remained unchanged at 0.000030, with a slight 0.48% outperformance over the week. However, the 30-day relative performance against BTC remains negative at -13.46%. The 30-day correlation with Bitcoin increased to 0.6907 from a 90-day baseline of 0.5206, and a Beta of 1.395 suggests NEAR Protocol tends to amplify Bitcoin's movements. Structurally, NEAR Protocol remains 90.38% below its all-time high.
Metric | Value |
NEAR Price | $1.97 (+2.39% 24h / +1.01% 7d / -8.40% 30d) |
Volume 24h | $188.3M |
Native Quote Vol. 24h | $1.3M |
Market Cap | $2.56B |
Market Cap Rank | 36 |
Circulating Supply | 1.30B NEAR |
ATH Distance | 90.38% below ATH |
Metric | Value |
NEAR/BTC Ratio | 0.00003000 |
Relative Perf. 7d vs BTC | +0.48% |
Relative Perf. 30d vs BTC | -13.47% |
Speculative Interest and Liquidations
Speculative interest in NEAR Protocol showed signs of contraction, with Open Interest decreasing by 3.19% over the past seven days to $0.075 billion, falling below its 90-day baseline of $0.085 billion. This indicates a reduction in leveraged participation. The 30-day funding Z-score of 0.3781 suggests a slight long bias in funding rates compared to its average, yet the 7-day cumulative funding rate was negative at -0.005262%, pointing to some short-term pressure on long positions or unwinding. Liquidation data revealed a notable skew, with long liquidations totaling $9.9 million (73.1%) over the past week, significantly outweighing short liquidations of $3.6 million (26.9%). This pattern of long liquidations dominating is consistent with the 30-day average, where long liquidations accounted for 67.2% of the total, suggesting a market prone to flushing out leveraged long exposure.
Metric | Value |
Funding Rate (current) | +0.0064% |
Funding Cumul. 7d | -0.0053% |
Open Interest | $0.07B (-3.19% 7d) |
Liq. 24h Longs | $0M |
Liq. 24h Shorts | $0M |
Liq. 7d Longs | $10M |
Liq. 7d Shorts | $4M |
Metric | Value |
Realized Vol 7d | +73.85% (90d avg: +126.20%) |
Realized Vol 30d | +73.80% |
Corr. BTC 30d | 0.6907 (90d avg: 0.5206) |
Beta vs BTC | 1.3950 |
Volume Momentum | 0.3555x |
Funding Z-Score 30d | 0.38σ |
Turnover Ratio | 0.0734 |
Liq. Intensity | 0.00528 |
Monitoring Conditions for Next Week
Monitoring conditions for the upcoming week include observing whether the current low volatility regime for NEAR Protocol persists or if a deviation from its 90-day baseline begins to emerge, which could signal a shift in price amplitude. The continued contraction of Open Interest, alongside the mixed signals from funding rates, will be crucial in assessing whether leveraged participants are re-engaging or further reducing exposure, potentially impacting price discovery. Furthermore, the ability of NEAR Protocol to sustain its recent slight outperformance against Bitcoin, particularly in an environment where its correlation and beta to BTC have increased, will indicate its autonomous strength or continued reliance on broader market movements. The upcoming Unemployment Claims data on July 23rd could introduce external volatility, potentially interacting with these internal market dynamics.
Indicator | Value | Variation |
Broad Dollar Index | 120.50 | flat (7d) |
US 10Y Yield | 4.57% | -0.05pp (7d) |
Fed Balance Sheet | $6743B | +$7,419M (7d) |
M2 Money Supply | $23,052B | +$247.8B (1m) |
Fear & Greed | 29 (Fear) | +7 pts (7d) |
Fear & Greed Index: Alternative.me
NEAR Protocol Weekly Takeaway
At week's close, NEAR Protocol presents a profile of reduced internal dynamism, characterized by significantly lower volatility and a contraction in leveraged positioning. While price action remained relatively stable over the past seven days, the underlying derivatives market shows a clear unwinding of Open Interest and a persistent tendency for long liquidations to dominate. This suggests that despite a period of NEAR Protocol stability in price, the market's speculative conviction remains subdued, with a higher sensitivity to downside movements for leveraged long positions. Swing traders may interpret this as a market currently lacking strong directional conviction from leveraged participants, operating within a tighter range until a clearer catalyst or shift in positioning emerges.
Disclaimer
This analysis of NEAR Protocol's fundamental state is for informational purposes only and does not constitute investment advice or a recommendation to buy or sell any asset.


