DOGE Bearish Trend Analysis: Critical 0.09 Support Test
- CopyTradia Intelligence

- Jun 4
- 4 min read
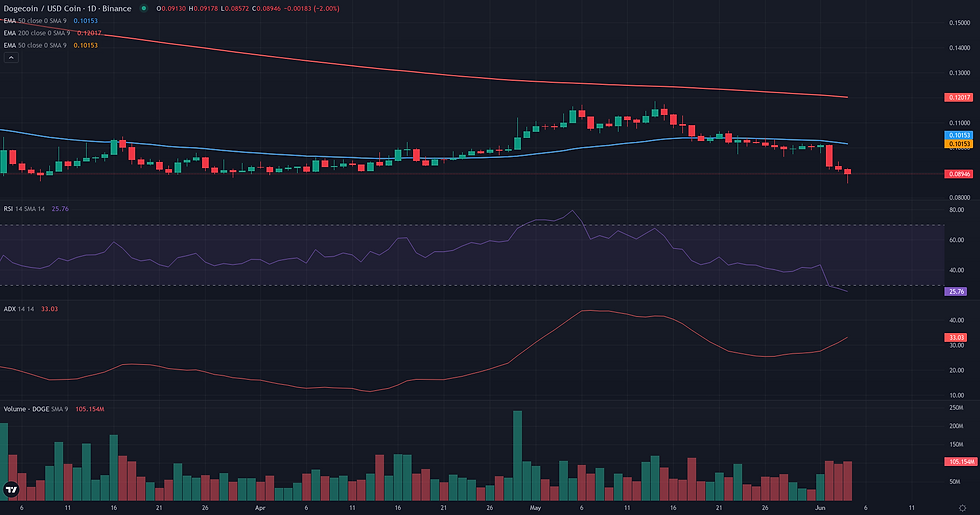
This DOGE bearish trend analysis examines the current DOGE/USDC structure in the context of support defense and weakening alternative frameworks. DOGE/USDC is currently navigating a critical phase, defined by a strong bearish trend that has pushed the price down to the significant 0.09 support level. The daily chart reflects a market under considerable selling pressure, with the price trading well below its 50-day (0.10) and 200-day (0.12) exponential moving averages. Momentum indicators confirm this environment; the Average Directional Index (ADX) on the daily timeframe stands at 30.89, signaling a robust trend, while the Relative Strength Index (RSI) has entered oversold territory at 27.76. This technical pressure at a key support level aligns with the latest fundamental context, which highlights deteriorating market sentiment and a reduction in leveraged positioning. The current structure presents a classic conflict between an established downtrend and a potential exhaustion point, setting the stage for the competing technical frameworks detailed below.

Range & Rebound Resolution: Support and Friction Zones
Following the identification of a plausible Range/Rebound framework, the resolution analysis for DOGE/USDC focuses on the price action around the critical validation zone of 0.09 to 0.10 USDC. The framework's integrity hinges on the defense of the 0.09 USDC level, which represents a multi-month support floor visible on the weekly chart. A daily close below this level would constitute a structural breakdown, thereby invalidating the rebound thesis and suggesting a continuation of the bearish trend. Should the 0.09 USDC support hold, the path to recovery is marked by significant obstacles. The first friction zone is located at the 0.10 USDC breakdown point. This level is now a formidable resistance cluster, reinforced by the D1 EMA 50 and the Weekly Pivot. A decisive reclaim of 0.10 USDC is the primary condition for confirming the rebound's viability. Beyond this, a secondary friction zone exists around 0.11 USDC, corresponding to the Weekly R2 pivot. If the rebound successfully navigates these hurdles, the primary projection zone lies at 0.12 USDC. This area represents a major confluence of long-term resistance, including both the D1 and W1 200-period EMAs, and marks the upper band of the broader trading range. The framework's coherence would weaken if the price fails to lift off from 0.09 USDC or faces a swift rejection from the 0.10 USDC resistance, indicating that selling pressure remains dominant.


Breakout: Structural Catalyst Assessment
The Breakout framework is currently not plausible for DOGE/USDC. The market structure is in direct opposition to the core requirements of a bullish structural break, which presupposes a phase of consolidation or energy accumulation beneath a well-defined resistance. Instead, the daily chart shows a clear bearish trend in progress. The price has recently breached the 0.10 support level, which coincides with the D1 EMA 50, and is now challenging the 0.09 lows while sitting on its lower Bollinger Band. This price action signals bearish expansion, not bullish compression. Momentum indicators corroborate this view, with the D1 RSI deep in oversold territory at 27.76 and the ADX at 30.89 confirming the trend's strength. The weekly context further solidifies this bearish bias, as the price remains significantly below major long-term averages like the W1 EMA 200 at 0.12. For a breakout scenario to become relevant, the structure would first need to reverse its current trajectory, reclaim the 0.10 level, and then build a sustained consolidation range below the major resistance cluster at 0.12.

DOGE Bearish Trend Analysis: Directional Flow Assessment
The technical structure for DOGE/USDC presents a plausible bearish continuation scenario, anchored by a clear and consistent directional flow across multiple timeframes. The daily chart shows price has decisively broken below the critical 0.10 support level, a zone that held throughout most of May and now aligns with the D1 EMA50. This breakdown is occurring within a well-established downtrend, with price trading firmly below both its D1 EMA200 (0.12) and W1 EMA200 (0.12), confirming a bearish structural alignment. The trend's strength is underscored by an ADX above 30 on the daily timeframe. The weekly context reinforces this view, with its own bearish structure and an RSI (40.92) that suggests further downside potential. The primary factor tempering this outlook is the daily RSI, which at 27.76 has entered oversold territory. While this confirms the strength of the recent selling pressure, it also introduces the possibility of a short-term bounce before the trend potentially resumes. However, the dominant structural evidence currently supports the continuation framework.
Comparative Framework Verdict
Comparing the three technical frameworks, the analysis reveals two plausible yet opposing scenarios for DOGE/USDC, with one framework deemed irrelevant. The bearish Continuation framework emerges as the dominant scenario, primarily because it aligns with the strong, established downtrend confirmed by an ADX above 30 and price action below all key daily and weekly moving averages. This framework's validity rests on the price failing to reclaim the former support level at 0.10, which has now flipped to resistance. Presenting a direct counter-argument, the Range/Rebound framework is considered a plausible secondary scenario. Its viability is rooted in the price testing a significant confluence of historical support around the 0.09 level, a floor that has held on the weekly chart for several months. This structural support is reinforced by oversold momentum indicators, particularly the daily RSI, suggesting the bearish move may be overextended and due for a pause or reversal. The Breakout framework, in contrast, is not plausible. The market is in a state of bearish expansion, the opposite of the price compression required for a bullish breakout scenario. Ultimately, the market is at a clear inflection point. The immediate price action around the 0.09-0.10 zone will be decisive in validating either the trend continuation or the support-driven rebound.
For broader market context, readers can also review the latest related fundamental analysis for this pair.
For live market monitoring and the full interactive chart, readers can access the dedicated DOGE Market Hub.
Disclaimer
CopyTradia provides technical analysis for informational and educational purposes only. This content does not constitute financial advice, investment recommendations, or trading signals. Cryptocurrency markets are highly volatile. Past performance is not indicative of future results. Always conduct your own research (DYOR) and consult a qualified financial advisor before making any investment decisions.

Comments