DOGE Bearish Trend Analysis: Price Tests Critical 0.08 Support
- CopyTradia Intelligence

- 2 days ago
- 5 min read
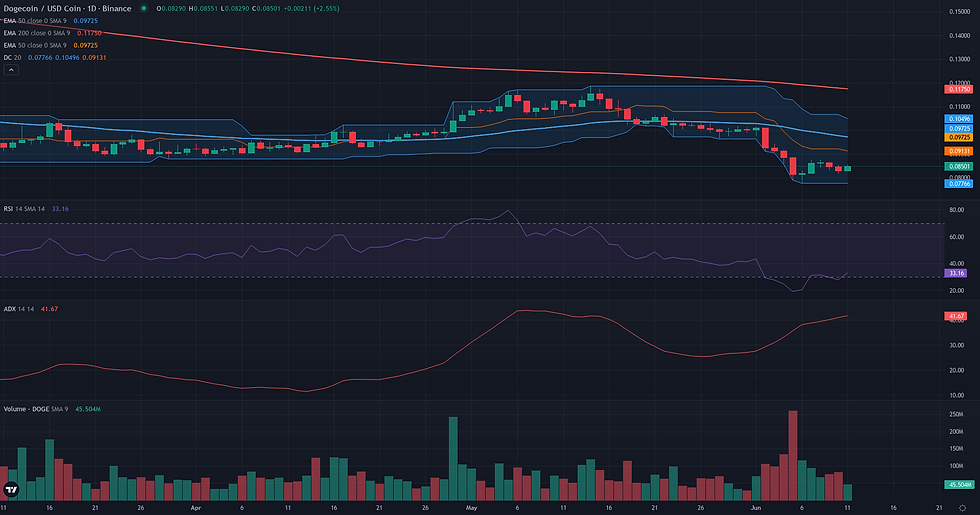
This DOGE bearish trend analysis examines the current DOGE/USDC structure in the context of support defense and weakening alternative frameworks. DOGE/USDC is currently navigating a critical technical juncture, characterized by a powerful downtrend testing a significant historical support level. With the daily price closing at 0.08, the market is exhibiting clear signs of bearish pressure. This is quantified by a high ADX reading of 40.92, which confirms the presence of a strong, directional trend. Simultaneously, the daily RSI has fallen deep into oversold territory at 27.91, suggesting that downward momentum may be overextended and could be nearing a point of exhaustion or consolidation. The price remains significantly below its key long-term moving averages, such as the 200-day EMA at 0.12, reinforcing the dominant bearish context. This technical pressure aligns with the latest fundamental analysis, which points to significant deleveraging and a market sentiment of 'Extreme Fear', creating a challenging backdrop for any potential recovery. The current price action represents a classic conflict between strong trend momentum and oversold conditions at a major support zone.

Range & Rebound Resolution: Support and Friction Zones
The resolution for the DOGE/USDC range rebound framework, initially assessed as borderline, centers on the price action between the critical 0.08 support and the 0.10 resistance. The validation of this scenario requires not just holding the 0.08 support but also reclaiming the 0.09 level, which corresponds to the Weekly Pivot. The 4H data shows a struggle in this zone, with a neutral RSI (50.93) but a concerningly low Volume Oscillator (-14.79), suggesting any upward movement lacks conviction. The invalidation zone for this rebound thesis is clearly defined. A daily close below the 0.08 support would break the multi-week low and signify a failure of the entire support structure, likely triggering a continuation of the dominant downtrend. Should the price stabilize above 0.08, it faces immediate friction around the 0.09 Weekly Pivot. A more formidable obstacle is located at the 0.10 level, a confluence of the D1 EMA 50 and the Weekly R1 pivot. This zone represents a significant structural barrier that must be overcome for the rebound to be considered credible. If the framework confirms and clears these friction zones, technical projection zones can be identified. The first is the 0.11 area, marked by the Weekly R2 pivot. A more substantial projection would target the major resistance cluster at 0.12, where the D1 and W1 200-period EMAs converge. Confirmation of the rebound's strength would come from a daily close above 0.10, while a persistent failure to overcome 0.09 would be a clear sign of weakening.


Breakout: Structural Catalyst Assessment
The Breakout framework is assessed as not plausible for DOGE/USDC at this time. The market structure is in direct opposition to the conditions required for a structural breakout, which typically involves a phase of price compression beneath a well-defined resistance. Instead, the daily chart displays a clear and established downtrend, with price having recently fallen from the 0.10-0.11 range to current levels around 0.08. This bearish price action is not a preparation for a breakout but rather a trend continuation to the downside. The technical indicators corroborate this reading unequivocally. The ADX D1, at a high value of 40.92, confirms the presence of a strong trend, which is visibly bearish. Concurrently, the RSI D1 is deep in oversold territory at 27.91, signaling intense selling pressure, not accumulating strength. Furthermore, the price is trading well below key structural resistance levels such as the D1 EMA 50 (0.10) and the D1 EMA 200 (0.12), moving away from them rather than coiling for a test. The weekly context provides no support for a bullish reversal, as the price remains firmly under the W1 EMA 200 (0.12), reinforcing the long-term bearish regime. For the Breakout framework to become relevant, a significant structural change would be required, starting with a reclaim of the 0.10 area, followed by a period of sustained consolidation.
DOGE Bearish Trend Analysis: Directional Flow Assessment
The technical structure for DOGE/USDC presents a plausible case for a bearish continuation. A stable directional flow to the downside is well-established on both daily and weekly timeframes. The daily trend's strength is quantified by a high ADX reading of 40.92, indicating a robust, non-ranging market. This bearish sentiment is reinforced by the price's position, which remains firmly below key moving averages, including the D1 EMA 50 at 0.10 and the D1 EMA 200 at 0.12. The weekly chart provides further context, confirming a multi-month downtrend with no significant structural support immediately apparent. The recent sharp decline on June 5th, which pushed the price to the 0.08 level, occurred on significant volume, validating the sellers' control. However, the reading is not without nuance. The D1 RSI has entered oversold territory at 27.91, and recent price action on both D1 and H1 charts shows a consolidation phase. This suggests a temporary exhaustion of bearish momentum and the possibility of a short-term pause or bounce. Despite this, these factors currently appear as a consolidation within a dominant trend rather than a structural reversal, thus keeping the bearish continuation framework technically plausible.

Comparative Framework Verdict
Comparing the three technical frameworks for DOGE/USDC, a clear hierarchy of plausibility emerges, dominated by the prevailing bearish trend. The Continuation framework is assessed as the most plausible scenario. It aligns directly with the strong downtrend indicated by a high daily ADX of 40.92 and the price's position well below all major daily and weekly moving averages. A sustained break below the critical 0.08 support would serve as validation for this outlook, signaling a resumption of the established directional move. In a secondary position is the Range/Rebound framework, rated as borderline. This scenario acknowledges the potential for a technical bounce from the 0.08 support cluster, which is reinforced by an oversold daily RSI. While a temporary relief rally is possible, the sheer strength of the underlying trend, as highlighted by the ADX, acts as a significant weakening factor, making this a lower-probability outcome. Finally, the Breakout framework is not plausible. The market is in a distinct trending phase, moving away from resistance rather than compressing beneath it, which is a prerequisite for a structural breakout. Ultimately, the market structure hinges on the price action around the 0.08 level. A decisive breakdown would confirm the continuation thesis, whereas a successful defense of this support would lend more weight to the borderline rebound scenario.
For broader market context, readers can also review the latest related fundamental analysis for this pair.
For live market monitoring and the full interactive chart, readers can access the dedicated DOGE Market Hub.
Disclaimer
CopyTradia provides technical analysis for informational and educational purposes only. This content does not constitute financial advice, investment recommendations, or trading signals. Cryptocurrency markets are highly volatile. Past performance is not indicative of future results. Always conduct your own research (DYOR) and consult a qualified financial advisor before making any investment decisions.

Comments