Chainlink Breakout Analysis: LINK Tests $8.83 Resistance

This Chainlink breakout analysis examines the current LINK/USDC structure in the context of support defense and weakening alternative frameworks. LINK/USDC is currently at a critical juncture, testing a well-defined resistance ceiling around the $8.83 mark following a multi-week consolidation period. The daily chart reflects a market storing energy, evidenced by a very low ADX reading of 14.97, which signals a lack of a directional trend despite recent upward price movement. While the D1 RSI at 64.26 indicates healthy bullish momentum building beneath this resistance, the broader context remains cautious. The price is still trading significantly below key weekly moving averages, framing the current rally as a counter-trend move. This technical setup of range compression aligns with recent market analysis, which points to an expansion in open interest and derivative positioning during a period of decreasing volatility. The immediate challenge for LINK is to resolve this compression, either by decisively breaking the overhead resistance or by rotating back within its established range.
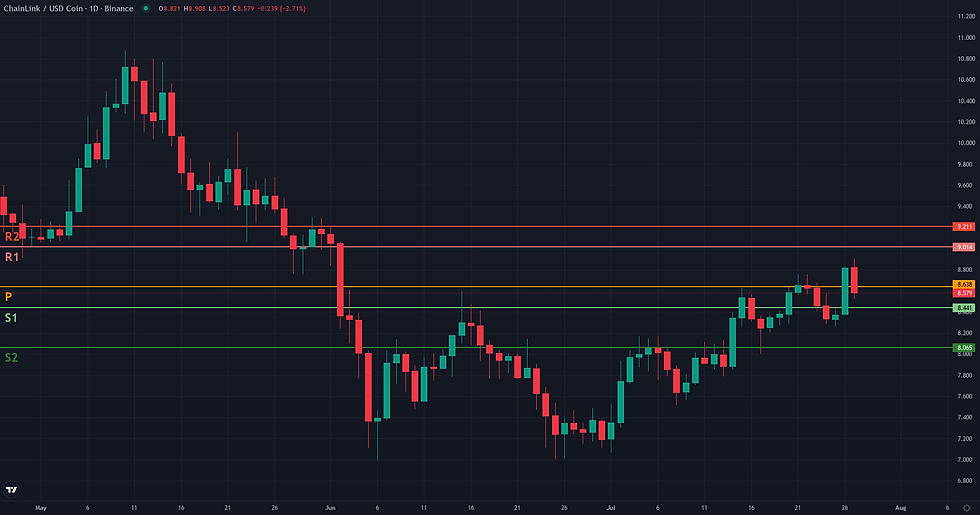
Range & Rebound: Market Structure Assessment
The Range/Rebound framework is assessed as not plausible for LINK/USDC at this time due to a structural mismatch between the framework's requirements and the current market position. While the market has established a clear consolidation range over the past several weeks, confirmed by a very low D1 ADX of 14.97, the current price at 8.82 is testing the upper boundary of this range. This is a position of potential resistance, not support. The framework is designed to identify stabilization and rebound opportunities near the lower bound of a structure. Currently, the price is challenging a confluence of resistance levels, including the recent weekly high of 8.83, the D1 Upper Bollinger Band at 8.90, and the W1 Middle Bollinger Band at 8.75. Applying a rebound strategy at a structural ceiling is contrary to its logic. For this framework to become relevant, the market would need to demonstrate a rotation back towards the lower part of the range, for example near the D1 Lower Bollinger Band at 7.60, where a new stabilization phase could be evaluated.
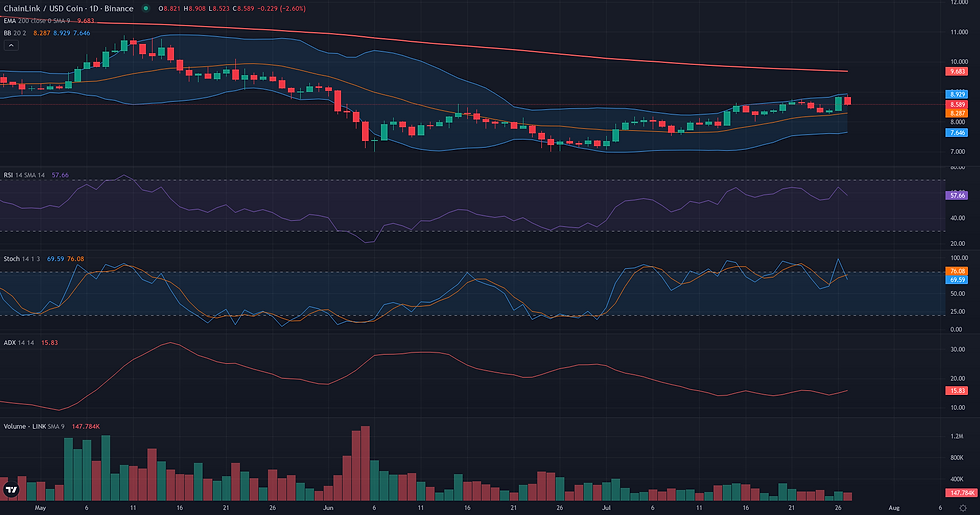
Chainlink Breakout Analysis: Structural Catalyst Assessment
The technical structure for LINK/USDC presents a classic but conflicted breakout scenario. On the daily timeframe, the price action has formed a well-defined consolidation range throughout July, repeatedly testing a resistance ceiling located around the 8.83 level, which aligns with the upper Donchian channel band. This period of compression is technically confirmed by a very low ADX reading of 14.97, often a precursor to a volatility expansion. Furthermore, the daily RSI at 64.26 indicates a healthy build-up of bullish momentum. However, this constructive daily picture is challenged by two significant factors. First, the recent push towards the resistance lacks volume confirmation, with the Volume Oscillator at -22.19, suggesting that conviction behind the move is questionable. Second, and more importantly, the weekly context acts as a major headwind. The price remains significantly below key weekly moving averages such as the EMA50 at 11.31, framing this potential D1 breakout as a counter-trend move within a broader bearish structure. The weekly RSI at 44.95 reinforces this lack of higher-timeframe momentum. This tension between a clean D1 consolidation pattern and a challenging weekly backdrop makes the breakout framework borderline, pending a decisive price resolution with volume confirmation.
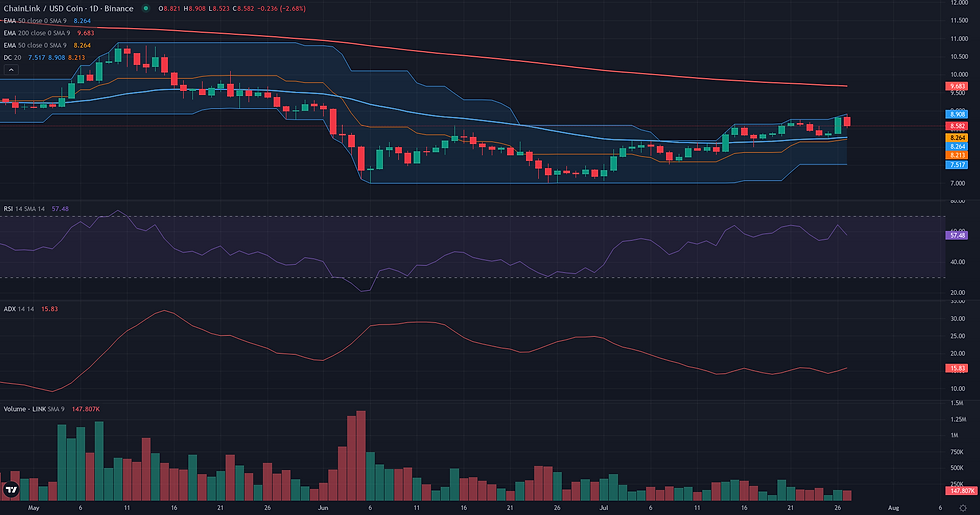
Continuation: Directional Flow Assessment
The technical structure for a bullish continuation presents a borderline case, marked by a clear conflict between price action and trend strength indicators. On one hand, the daily chart displays a constructive bullish sequence that began in early July, characterized by a series of higher highs and higher lows. The recent powerful candle to 8.82, pushing price decisively above the D1 EMA50 (8.25), reinforces this positive structural reading. The D1 RSI at 64.26 further supports the presence of immediate bullish momentum. However, this optimistic view is severely tempered by a critically low D1 ADX of 14.97. This value indicates a distinct lack of a directional trend, suggesting the market is in a consolidating or ranging phase rather than a "Stable Directional Flow." This weakness is compounded by the broader weekly context, where the price remains firmly below key bearish references like the W1 EMA50 (11.31) and the W1 RSI remains below the neutral 50 mark. Therefore, the current daily uptrend is best interpreted as a counter-trend rally within a larger bearish structure. The plausibility of a sustained continuation hinges on whether the recent momentum can evolve into a genuine trend, a development not yet confirmed by the data.

Comparative Framework Verdict
In assessing the three technical frameworks for LINK/USDC, a clear hierarchy emerges based on the current market structure. The Range/Rebound framework is deemed not plausible. Its logic requires a price position near a structural support for a potential bounce, whereas LINK is currently testing the upper boundary of its range at $8.83, a point of resistance. Both the Breakout and Continuation frameworks are rated as borderline, capturing the central conflict in the current price action. The Breakout framework is considered the dominant scenario of the two. It accurately reflects the present conditions: a clear resistance level being tested after a period of price compression, indicated by a very low D1 ADX. The Continuation framework is secondary; while it correctly identifies the recent bullish sequence of higher highs and lows on the daily chart, its core requirement for a stable, trending market is directly contradicted by the low ADX reading. A continuation of the uptrend is contingent on a successful breakout first occurring. Ultimately, the market is coiled at a decision point. The resolution around the $8.83 level will be critical. A failure to push higher would favor a range-bound interpretation, while a decisive close above this level, ideally with an increase in volume and a rising ADX, would lend significant weight to the breakout and subsequent continuation scenarios.
For broader market context, readers can also review the latest related fundamental analysis for this pair.
For live market monitoring and the full interactive chart, readers can access the dedicated LINK Market Hub.
Disclaimer
CopyTradia provides technical analysis for informational and educational purposes only. This content does not constitute financial advice, investment recommendations, or trading signals. Cryptocurrency markets are highly volatile. Past performance is not indicative of future results. Always conduct your own research (DYOR) and consult a qualified financial advisor before making any investment decisions.


