Chainlink Positioning Shows Expanding Leverage Amidst Relative Strength

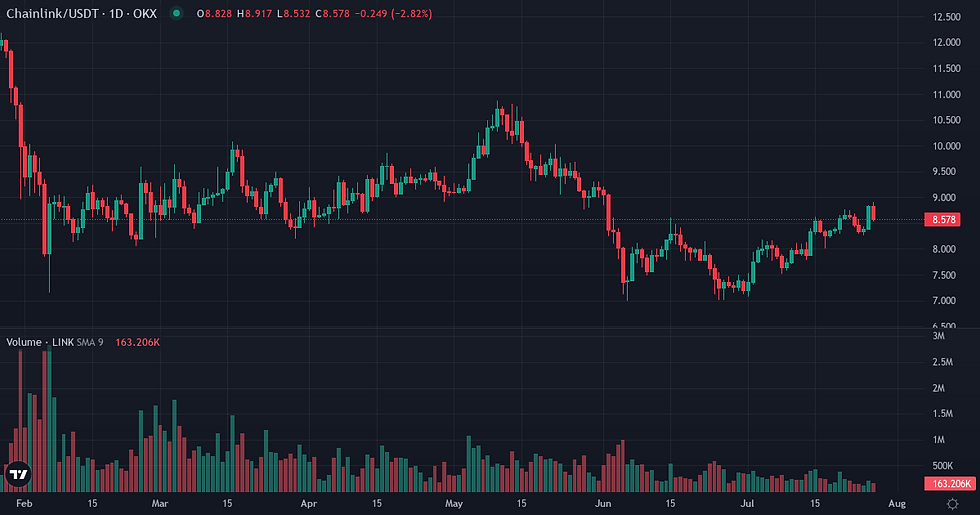
Chainlink experienced a week of positive price action, extending its monthly gains and demonstrating relative strength against Bitcoin. This upward movement occurred with decreasing volatility and an expansion in open interest, suggesting a specific Chainlink positioning is developing within the derivatives market.
Chainlink Price Action and Volatility
Chainlink's spot price increased by 3.60% over the past seven days, building on a 30-day gain of 18.80%. This upward movement occurred while 7-day realized volatility stood at 35.46%, notably below its 90-day baseline of 57.44%. The asset maintained a positive posture against Bitcoin, showing a 2.63% outperformance over the week and a 9.84% gain over the past month. LINK's 30-day correlation with Bitcoin remained high at 0.9390, with a Beta of 1.337, indicating its movements largely amplify those of BTC. The asset remains 83.73% below its all-time high.

Metric | Value |
LINK Price | $8.58 (+3.80% 24h / +3.60% 7d / +18.80% 30d) |
Volume 24h | $243.3M |
Native Quote Vol. 24h | $1.0M |
Market Cap | $6.42B |
Market Cap Rank | 18 |
Circulating Supply | 748.10M LINK |
ATH Distance | 83.73% below ATH |
Metric | Value |
LINK/BTC Ratio | 0.000133 |
Relative Perf. 7d vs BTC | +2.63% |
Relative Perf. 30d vs BTC | +9.84% |
Derivatives Market: Open Interest Expansion
Speculative interest in Chainlink expanded, with Open Interest increasing by 8.33% over the past seven days to $0.080 billion, exceeding its 90-day baseline of $0.076 billion. The current funding rate of 0.010000% and a 30-day Funding Z-Score of 0.9385 indicate a moderately elevated cost for long positions, suggesting a directional bias in leveraged exposure. Over the last seven days, long liquidations totaled $3.5 million (56.8%), slightly outweighing short liquidations of $2.6 million (43.2%). The 30-day average liquidation profile remains balanced, indicating no significant directional skew in forced deleveraging.
Metric | Value |
Funding Rate (current) | +0.0100% |
Funding Cumul. 7d | +0.0337% |
Open Interest | $0.08B (+8.33% 7d) |
Liq. 24h Longs | $0M |
Liq. 24h Shorts | $0M |
Liq. 7d Longs | $3M |
Liq. 7d Shorts | $3M |
Metric | Value |
Realized Vol 7d | +35.46% (90d avg: +57.44%) |
Realized Vol 30d | +46.08% |
Corr. BTC 30d | 0.9390 (90d avg: 0.9049) |
Beta vs BTC | 1.3370 |
Volume Momentum | 0.5952x |
Funding Z-Score 30d | 0.94σ |
Turnover Ratio | 0.0379 |
Liq. Intensity | 0.00095 |
Key Monitoring Conditions for Chainlink
Monitoring conditions for the coming week include observing whether Chainlink can sustain its relative outperformance against Bitcoin, particularly as its 30-day correlation remains high. The evolution of Open Interest and funding rates will be crucial; a continued expansion of OI alongside sustained positive funding would suggest further conviction in the current price trend, while a divergence could signal a shift in speculative sentiment. Furthermore, the broader market's reaction to the upcoming Federal Funds Rate decision and FOMC Statement on July 29th, followed by key economic indicators like Advance GDP and Core PCE Price Index on July 30th, could influence overall crypto market sentiment and potentially impact LINK's trajectory given its high correlation to BTC.
Indicator | Value | Variation |
Broad Dollar Index | 120.53 | flat (7d) |
US 10Y Yield | 4.71% | +0.11pp (7d) |
Fed Balance Sheet | $6747B | +$4,350M (7d) |
M2 Money Supply | $23,052B | +$247.8B (1m) |
Fear & Greed | 30 (Fear) | +5 pts (7d) |
Fear & Greed Index: Alternative.me
Chainlink Weekly Takeaway
Chainlink concludes the week in a regime characterized by positive price momentum and decreasing volatility, coupled with expanding leveraged interest. The asset's sustained relative strength against Bitcoin suggests an autonomous impulse within the broader crypto market. While speculative positioning shows a slight bias towards long exposure, the balanced liquidation profile indicates that market participants are not excessively skewed in one direction, despite the increase in Open Interest. This internal coherence points to a period where LINK is attracting capital and maintaining its trajectory with a degree of internal stability.
Disclaimer
This article provides a fundamental analysis of Chainlink's market dynamics and does not constitute investment advice or a recommendation to buy or sell any asset.


