BNB Bullish Continuation Analysis: Overbought Signals

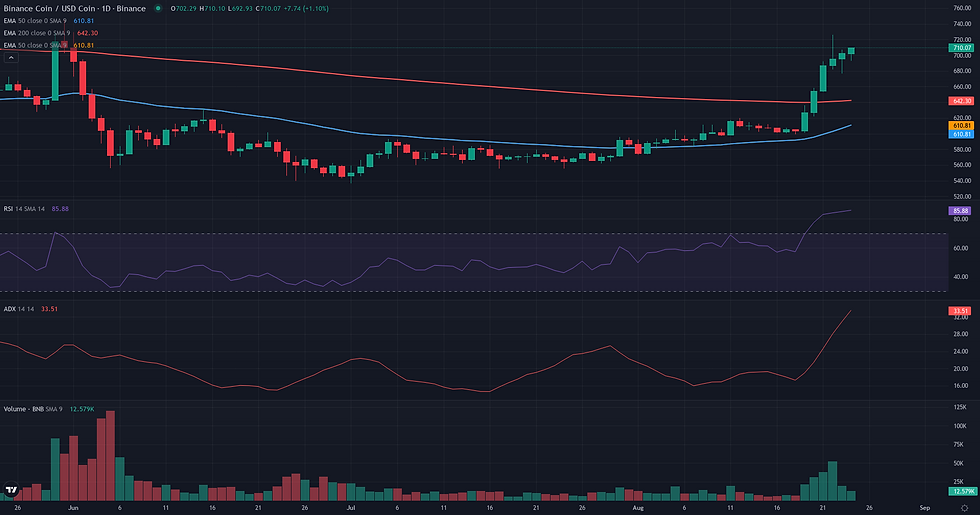
This BNB bullish continuation analysis examines the current BNB/USDC structure in the context of support defense and weakening alternative frameworks. BNB/USDC is currently navigating a period of intense bullish momentum, having decisively broken out from a multi-week consolidation range. The price closed the daily session at 702.33, well above key long-term moving averages, signaling a significant shift in market structure. This uptrend is confirmed by a strong ADX reading of 30.78 on the daily chart. However, this powerful impulse has pushed short-term momentum indicators to extreme levels, with the D1 RSI reaching a deeply overbought reading of 84.96. This creates a complex technical picture of a strong trend battling near-term exhaustion. This strong technical performance aligns with the latest market analysis, which highlights a significant 15.90% weekly price appreciation and a broader market sentiment shift from 'Fear' to 'Greed'. The current structure thus presents a critical juncture, forcing an evaluation of whether the trend has the strength to continue or if a period of consolidation is imminent.

Range & Rebound: Market Structure Assessment
The Range/Rebound framework is currently not plausible for BNB/USDC. The market structure is characterized by a powerful bullish breakout, which is the antithesis of the stabilization phase this framework seeks to identify. On the daily timeframe, the price is in a strong impulsive wave, confirmed by an extremely overbought RSI at 84.96 and a trending ADX at 30.78. Price action is consistently closing above the D1 Upper Bollinger Band (688.86), signaling trend acceleration rather than exhaustion near a support level. This dynamic is reinforced on the weekly chart, which displays a decisive breakout from a multi-week consolidation range, with the last candle closing above the W1 Upper Bollinger Band (698.66). A Range/Rebound scenario would require a significant price correction and the subsequent formation of a clear support base. For this framework to become relevant, the market would first need to establish a new, lower equilibrium, demonstrating a clear deceleration of momentum and stabilization within a quantifiable support zone.

Breakout: Structural Catalyst Assessment
The market structure for BNB/USDC presents a borderline case for the Breakout framework, characterized by a significant tension between a powerful, ongoing bullish move and clear signals of short-term exhaustion. The asset has recently experienced a dramatic price expansion, breaking out of a multi-month consolidation range with significant force. This move is technically well-supported: the D1 trend is strong, as indicated by an ADX of 30.78, and the surge was accompanied by a substantial increase in volume (Volume Oscillator at 57.26). Furthermore, the price has decisively reclaimed key long-term moving averages on both daily and weekly charts, notably closing the week above the W1 EMA 50 (680.71). However, this explosive dynamic has pushed short-term indicators to extreme levels, creating a high-risk environment for immediate continuation. The D1 RSI has reached 84.96, a level that signals a severely overbought market and often precedes a consolidation or corrective pullback. Price has also been trading far above its D1 upper Bollinger Band (688.86), reinforcing the thesis of overextension. The breakout candidate level is the recent high at 725.92, but attempting to clear it without a pause would be challenging. While the weekly context shows some room for growth before hitting major historical resistance around 744.92, the immediate risk of exhaustion on the daily timeframe makes the current structure borderline for a clean breakout entry.

BNB Bullish Continuation Analysis: Directional Flow Assessment
The technical structure for BNB/USDC presents a plausible case for a bullish continuation. The primary evidence is a powerful breakout on the daily chart, where price has decisively exited a multi-week consolidation phase. This impulse move, which began around the 600 USDC level, was accompanied by a significant surge in volume, as indicated by the Volume Oscillator D1 reaching 57.26. Structurally, the price has cleared several key resistance levels, most notably the D1 200-period EMA at 656.95, and is now trading firmly above it. This daily strength is reinforced by the weekly context. The most recent weekly candle was a large bullish bar that broke above its own range and the W1 50-period EMA (680.71), suggesting the start of a new directional leg on the higher timeframe. While the ADX D1 at 30.78 confirms a trending environment, the main factor requiring caution is the D1 RSI, which has reached an extreme overbought reading of 84.96. This signals that the current impulse is very extended and could be susceptible to a pullback or consolidation. However, in the context of a major structural breakout, such strong momentum supports the continuation thesis rather than invalidating it, though it highlights the risk of near-term volatility.
Comparative Framework Verdict
In assessing the current market structure for BNB/USDC, the three analytical frameworks provide a clear hierarchy of plausibility. The Bullish Continuation framework emerges as the most coherent thesis. Rated as plausible, it is anchored in the decisive, high-volume breakout from a multi-week consolidation range and the successful recapture of key long-term supports, such as the D1 200-period EMA. This view interprets the extreme D1 RSI reading not as an invalidation, but as a confirmation of powerful underlying momentum that supports a new directional leg. Rated as borderline, the Breakout framework presents a more tactical, secondary scenario. It correctly identifies the tension between the strong upward thrust and the severe overbought conditions, flagging the high risk of short-term exhaustion. This framework focuses on the immediate challenge of clearing the recent high near 725.92, a task made difficult by the extended indicators. Finally, the Range/Rebound framework is deemed not plausible, as its core requirement for price stabilization near a support level is directly contradicted by the current explosive, trend-driven market environment. Moving forward, the key dynamic to monitor will be how the market resolves the conflict between its strong structural breakout and its short-term overbought state.
For broader market context, readers can also review the latest related fundamental analysis for this pair.
For live market monitoring and the full interactive chart, readers can access the dedicated BNB Market Hub.
Disclaimer
CopyTradia provides technical analysis for informational and educational purposes only. This content does not constitute financial advice, investment recommendations, or trading signals. Cryptocurrency markets are highly volatile. Past performance is not indicative of future results. Always conduct your own research (DYOR) and consult a qualified financial advisor before making any investment decisions.


