BNB Market Dynamics: Absolute Gains Amidst Relative Weakness

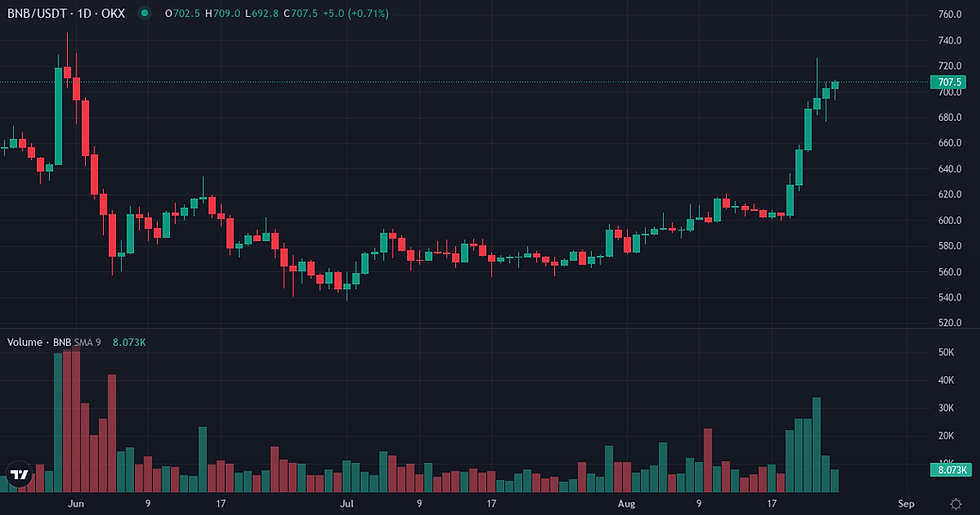
BNB experienced a week of significant absolute price appreciation, yet its market dynamics reveal a nuanced picture with recent underperformance relative to Bitcoin. The asset concluded the week at $708.26, marking a notable 15.90% increase over seven days and a 23.50% gain over the past month. This upward movement occurred as the broader crypto market shifted from a state of 'Fear' to 'Greed,' reflecting an improving sentiment across the ecosystem.
BNB Price Action and Volatility
BNB's price action demonstrated strong upward momentum over the past week, with its spot price climbing by 15.90%. This extended its monthly gain to 23.50%. Despite these absolute gains, BNB's performance relative to Bitcoin saw a decline of 7.8037% over the last seven days, bringing its pair/BTC ratio to 0.009008 from 0.009622 a week prior. However, the 30-day relative performance against BTC remains positive at 3.3812%, indicating a more complex trend over a longer horizon. Realized volatility over the past seven days was 42.80%, closely aligning with its 90-day baseline of 43.90%, suggesting that the recent price movement occurred within a familiar volatility regime. BNB currently holds the 5th rank by market capitalization, with a 24-hour trading volume of $1.086 billion, and remains 48.30% below its all-time high.
Metric | Value |
BNB Price | $708.26 (+1.87% 24h / +15.90% 7d / +23.50% 30d) |
Volume 24h | $1.09B |
Native Quote Vol. 24h | $8.8M |
Market Cap | $94.31B |
Market Cap Rank | 5 |
Circulating Supply | 133.16M BNB |
ATH Distance | 48.30% below ATH |
Metric | Value |
BNB/BTC Ratio | 0.009008 |
Relative Perf. 7d vs BTC | -7.80% |
Relative Perf. 30d vs BTC | +3.38% |
Speculative Positioning and Liquidations
Speculative positioning for BNB showed a notable increase in leveraged participation, with Open Interest rising by 22.93% over the past week to $0.450 billion, significantly above its 90-day baseline of $0.351 billion. This expansion in open exposure occurred while the 30-day funding Z-score registered at -0.8616, indicating that funding rates were below their 30-day average. The cumulative 7-day funding rate was 0.043849%, reflecting a generally subdued cost for long positions. Liquidation data revealed a short-heavy directional skew, with short liquidations totaling $17.2 million (68.9%) against long liquidations of $7.8 million (31.1%) over the last seven days. This suggests that recent price appreciation may have been fueled, in part, by the unwinding of short positions, rather than aggressive new long entries driving funding rates higher.

Metric | Value |
Funding Rate (current) | +0.0001% |
Funding Cumul. 7d | +0.0438% |
Open Interest | $0.45B (+22.93% 7d) |
Liq. 24h Longs | $0M |
Liq. 24h Shorts | $0M |
Liq. 7d Longs | $8M |
Liq. 7d Shorts | $17M |
Metric | Value |
Realized Vol 7d | +42.80% (90d avg: +43.90%) |
Realized Vol 30d | +31.73% |
Corr. BTC 30d | 0.6798 (90d avg: 0.7677) |
Beta vs BTC | 0.5702 |
Volume Momentum | 0.6742x |
Funding Z-Score 30d | -0.86σ |
Turnover Ratio | 0.0115 |
Liq. Intensity | 0.00027 |
Key Monitoring Conditions Ahead
Monitoring conditions for the upcoming week include observing whether the recent expansion in Open Interest continues to be accompanied by a negative funding Z-score, which would suggest a persistent lack of aggressive long conviction despite price gains, or if funding rates begin to reflect a more positive bias. A key dynamic to watch is BNB's relative performance against Bitcoin; a sustained recovery in the BNB/BTC ratio would indicate a reassertion of autonomous strength, while continued underperformance could signal a shift in capital allocation within the crypto market. Furthermore, the upcoming macro schedule, featuring the Core PCE Price Index and Prelim GDP data on August 26th, alongside Unemployment Claims on August 27th, could introduce broader market volatility that may interact with BNB's internal regime, potentially influencing its price trajectory and investor sentiment.
Indicator | Value | Variation |
Broad Dollar Index | 118.90 | flat (7d) |
US 10Y Yield | 4.69% | -0.03pp (7d) |
Fed Balance Sheet | $6746B | -$14,256M (7d) |
M2 Money Supply | $23,155B | +$99.6B (1m) |
Fear & Greed | 73 (Greed) | +32 pts (7d) |
Fear & Greed Index: Alternative.me
BNB Weekly Takeaway
At the close of the week, BNB exhibits a complex internal regime characterized by strong absolute price appreciation alongside a recent period of underperformance against Bitcoin. The significant increase in Open Interest indicates growing leveraged engagement, yet the prevailing negative funding Z-score and short-heavy liquidation profile suggest that much of the recent upward movement may have involved short squeezes rather than a robust, conviction-driven accumulation by leveraged longs. This positioning tension, combined with a return to baseline volatility, defines a market state where internal dynamics warrant close observation for signs of consolidation or a shift in underlying sentiment.
Disclaimer
This analysis of BNB market dynamics is purely for informational purposes and does not constitute investment advice or a recommendation to buy or sell any asset.


