SUI Range Rebound Analysis: Support Tested Amidst Weakness

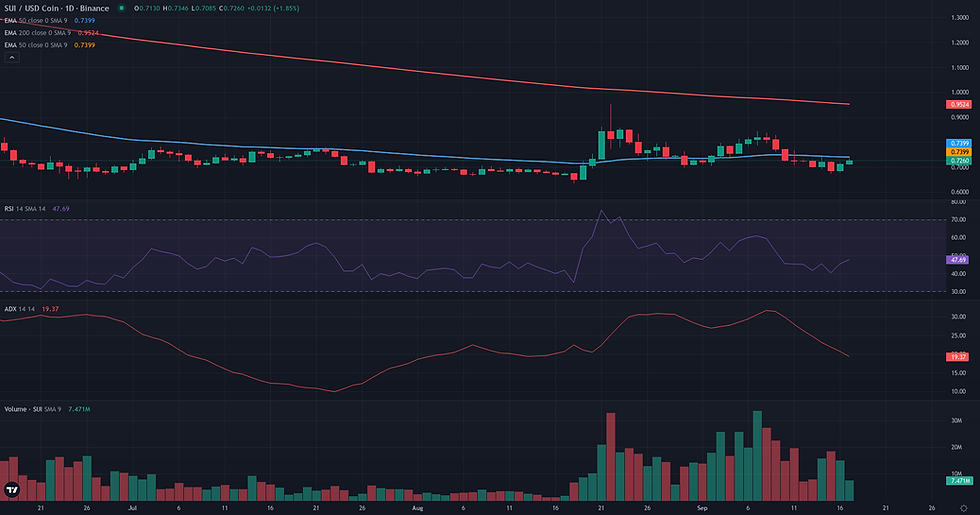
This SUI range rebound analysis examines the current SUI/USDC structure in the context of support defense and weakening alternative frameworks. The SUI/USDC pair is currently navigating a period of technical indecision, with its price consolidating near the weekly low around 0.71. The market structure exhibits a clear lack of directional conviction, a state reflected in key daily indicators. The Relative Strength Index (RSI) stands at 44.63, below the neutral 50 threshold, while the Average Directional Index (ADX) at 24.39 confirms a weak or non-trending environment. Structurally, the price remains below significant moving averages, including the 50-day EMA at 0.74 and the 200-day EMA at 0.88, reinforcing a broader bearish context. This technical picture of a non-trending market aligns with recent fundamental observations, which point to a significant contraction in Open Interest and a deleveraging phase for the asset. This backdrop sets the stage for analyzing whether the current support levels can foster a rebound or if the prevailing weakness will persist.
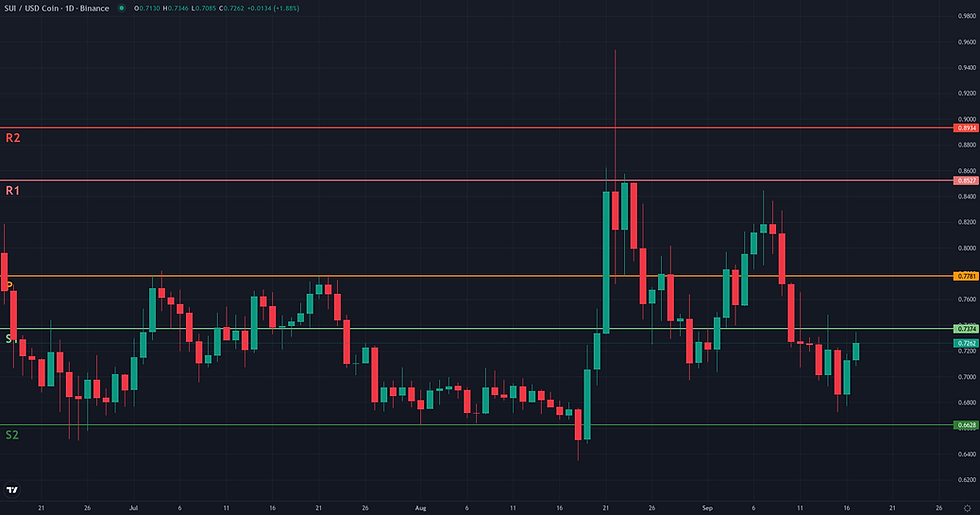
SUI Range Rebound Analysis: Support and Friction Zones
For the SUI/USDC range rebound framework, the path to confirmation is clearly defined by the ability to overcome immediate structural resistance. The validation zone requires a daily close above 0.75 USDC, a level reinforced by the D1 50-period EMA (0.74). This zone represents the first major test for buyers attempting to reverse the recent downtrend. Should the rebound fail, the framework would lose its coherence with a definitive structural breakdown. This invalidation condition is anchored at the 0.64 USDC swing low from mid-August; a daily close below this level would negate the range support thesis and suggest a continuation of the broader downtrend. If the rebound successfully validates, the price will face its next challenge in a friction zone between 0.78 (Weekly Pivot) and 0.82 USDC, an area of prior price congestion. A decisive move through this zone would strengthen the case for a sustained recovery. In such a scenario, the primary technical projection zone is located around 0.85 USDC, which corresponds to the Weekly R1 pivot. A more extended move could target the significant recent high of 0.95 USDC, which would signify a complete rotation to the top of the current range. Confirmation of the rebound's strength would involve establishing support above 0.75 and breaking the 0.78 pivot, while a rejection at 0.75 and a drop below 0.69 would be a clear sign of weakening momentum.
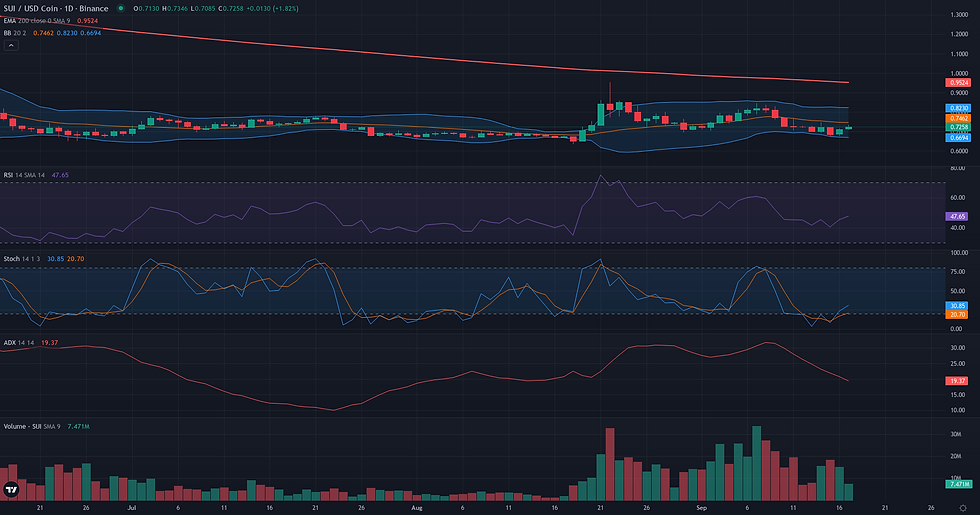
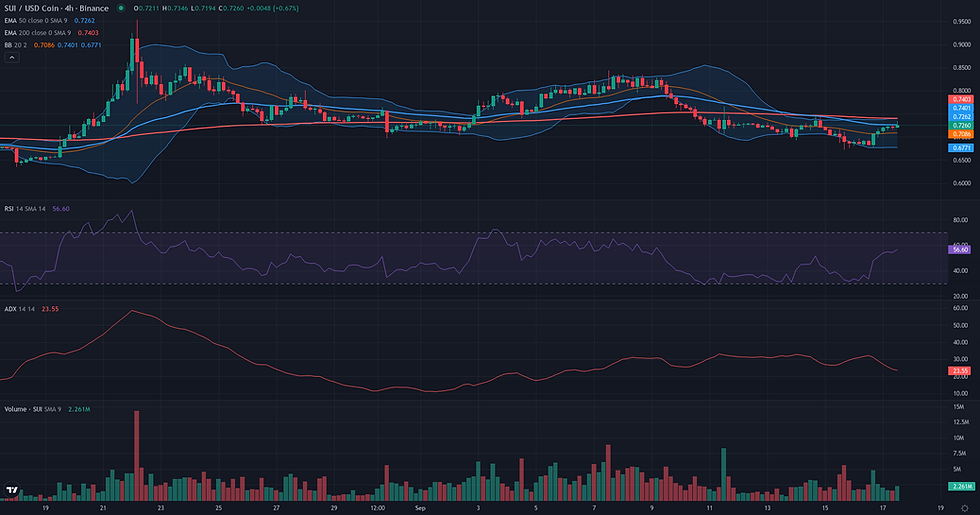
Breakout: Structural Catalyst Assessment
The Breakout framework is currently not technically plausible for SUI/USDC. The market structure lacks the essential preparatory characteristics for a structural break to the upside. Instead of consolidating beneath a clear resistance, the price is in a corrective phase after being rejected from the 0.85-0.95 zone in late August. The current price action is situated well below the key resistance area identified around 0.84-0.85, which is reinforced by the daily Donchian upper band and the weekly R1 pivot. Several factors confirm this reading. Momentum is clearly bearish, with the D1 RSI at 44.63, indicating a lack of buying pressure. This weakness is echoed on the higher timeframe, with the W1 RSI also below 50. Structurally, the price is trading below its D1 EMA 50 (0.74), which is now acting as immediate resistance, and remains significantly below the long-term bearish W1 EMA 50 (1.29). The declining volume, evidenced by a negative Volume Oscillator (-5.19), further undermines any breakout hypothesis by signaling low market participation. For this framework to become relevant, the price would first need to reverse its current downtrend, reclaim key moving averages, and build a sustained consolidation directly challenging the 0.84-0.85 resistance level, accompanied by a clear resurgence in momentum and volume.
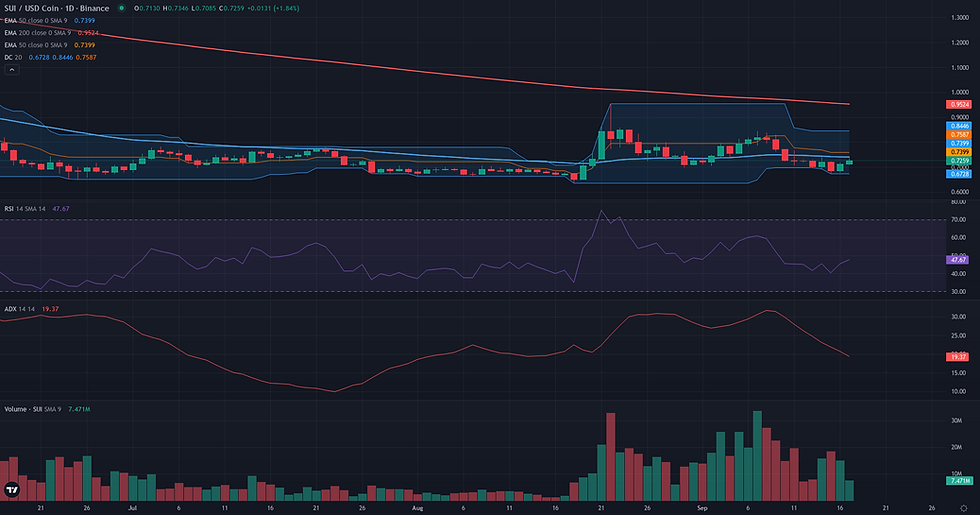
Continuation: Directional Flow Assessment
The Continuation framework is assessed as not plausible for SUI/USDC at this time. The primary reason is the absence of a 'Stable Directional Flow' in the daily structure. Following a significant rally to 0.95 in late August, the price has undergone a deep and prolonged correction, recently establishing a lower low at 0.67. This price action breaks the previous bullish sequence and suggests the market has entered either a corrective phase or a new downtrend, rather than a simple pause before continuation. This structural weakness is reinforced by key indicators. The price is currently trading below a confluence of resistance at 0.74, defined by the D1 EMA50 and the 4H EMA200. Momentum is also lacking, with the D1 RSI at 44.63 (below the neutral 50 mark) and a low D1 ADX of 24.39, indicating a non-trending environment. The broader weekly context further dampens the continuation scenario, as the price remains firmly within a long-term bearish structure, well below its weekly moving averages. For this framework to become relevant, the price would need to reclaim the 0.74 resistance zone and establish a new sequence of higher highs and higher lows, supported by a clear resurgence in directional momentum.
Comparative Framework Verdict
Comparing the three technical frameworks, the Range/Rebound scenario emerges as the only plausible structure for SUI/USDC this week. Its plausibility is rooted in the price action testing a significant support confluence between 0.66 and 0.68, which aligns with key weekly pivots and daily Bollinger Bands. This structural support is complemented by momentum indicators, such as an oversold D1 Stochastic and a low ADX reading, suggesting the recent downtrend is exhausted and the market is more likely to consolidate than to trend. For this framework to be validated, the price would need to achieve a daily close above the immediate resistance cluster around 0.75. In contrast, both the Breakout and Continuation frameworks are assessed as not plausible. The Breakout scenario fails due to the absence of pre-breakout compression near a major resistance; instead, the price is in a corrective phase far from any significant ceiling. Similarly, the Continuation framework is invalid because the prior bullish structure was broken by the recent lower low, and there is a distinct lack of directional momentum required to sustain a trend. The market's immediate future will likely be determined by its reaction to the 0.66-0.68 support zone. A successful defense could confirm the range-bound thesis, while a breakdown would invalidate it and open the door to further downside.
For broader market context, readers can also review the latest related fundamental analysis for this pair.
For live market monitoring and the full interactive chart, readers can access the dedicated SUI Market Hub.
Disclaimer
CopyTradia provides technical analysis for informational and educational purposes only. This content does not constitute financial advice, investment recommendations, or trading signals. Cryptocurrency markets are highly volatile. Past performance is not indicative of future results. Always conduct your own research (DYOR) and consult a qualified financial advisor before making any investment decisions.


