SUI Range Rebound Analysis: Consolidation Dominates

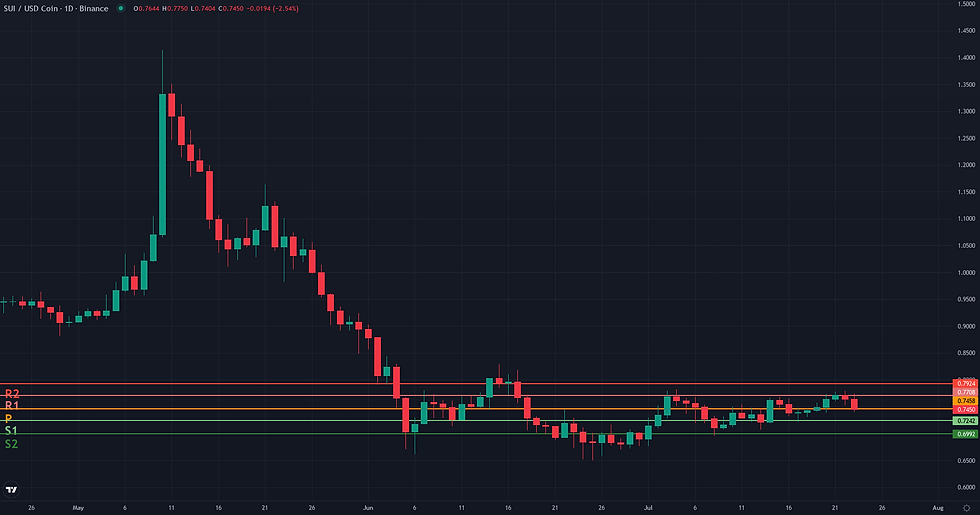
This SUI range rebound analysis examines the current SUI/USDC structure in the context of support defense and weakening alternative frameworks. The SUI/USDC market is currently defined by a distinct consolidation phase, with price action largely contained within a narrow horizontal range. Trading near 0.76 USDC, the pair shows a clear lack of directional momentum, a condition quantified by an extremely low D1 ADX reading of 10.43. This indicates a non-trending, equilibrium state. Daily momentum is neutral, with the RSI at 54.84, reflecting the sideways price movement that has persisted for several weeks between the approximate boundaries of 0.72 and 0.78. This technical picture of consolidation aligns with recent fundamental observations of SUI, which describe a market characterized by reduced volatility and a state of relative calm rather than strong directional conviction. While this stabilization provides a base, the pair remains significantly below long-term bearish references like the D1 EMA 200 at 1.10, creating a tension between the immediate range-bound structure and the broader downtrend.
SUI Range Rebound Analysis: Support and Friction Zones
The resolution of the SUI/USDC Range/Rebound framework hinges on the market's interaction with key structural zones defined on the daily chart. The foundational premise, established in the entry phase, is a successful defense of the 0.67 - 0.71 USDC support area. This zone represents the lower boundary of a multi-week consolidation range that has formed since the June lows. The framework would lose its technical coherence and be invalidated if there is a decisive daily close below the 0.65 USDC structural low. Such a breakdown would negate the entire stabilization pattern and likely signal a resumption of the preceding downtrend. Currently, the price is challenging the upper boundary of this range, encountering a significant friction zone at 0.77 - 0.78 USDC. This resistance is a confluence of the D1 EMA 50, weekly and daily pivot points, and recent price highs, making it a formidable obstacle. A failure to overcome this level would weaken the immediate rebound case and could trigger a rotation back towards the 0.67-0.71 support, which would be the true test of the framework. A sustained daily close above 0.78 USDC would serve as a confirmation condition, suggesting the rebound is gaining traction. Should the framework confirm, the first technical projection zone lies at the 0.80 - 0.83 USDC area, corresponding to mid-June highs. A more substantial resolution would target the 0.89 - 0.91 USDC level, a key resistance from late May.


Breakout: Structural Catalyst Assessment
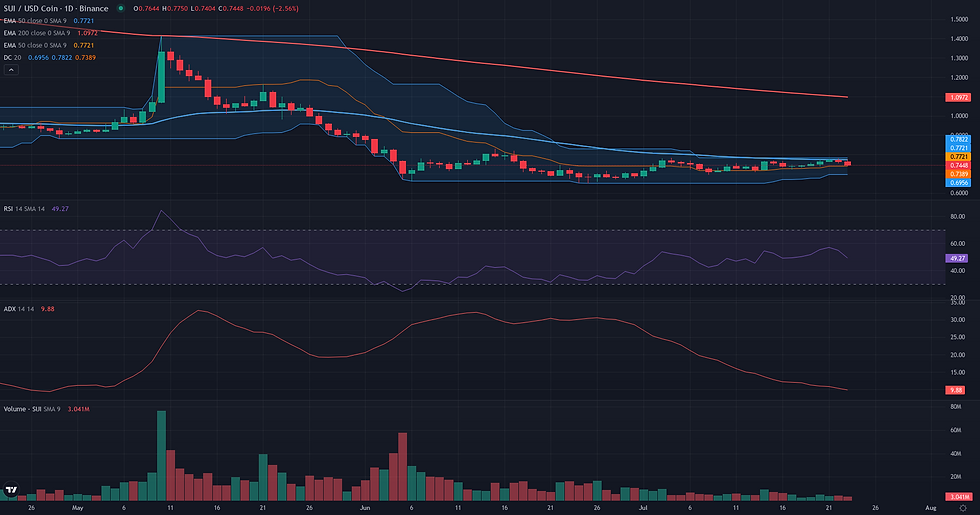
The Breakout framework for SUI/USDC is currently borderline, defined by a significant tension between a constructive daily chart pattern and a hostile weekly context. On the daily timeframe, the market has formed a clear consolidation structure over the past month, characterized by a well-defined horizontal resistance ceiling at the 0.77-0.78 zone. This level has been tested repeatedly, and its significance is reinforced by a confluence of technical indicators, including the D1 Donchian upper band (0.78) and the D1 EMA 50 (0.77). The very low D1 ADX reading of 10.43 confirms this lack of trend, suggesting energy is being compressed in a manner typical of a pre-breakout phase. However, this local setup faces strong headwinds from the weekly chart, which remains in a clear downtrend with price trading substantially below key moving averages. Furthermore, momentum indicators on the daily chart, such as the RSI at 54.84 and a negative Volume Oscillator, do not yet signal the decisive buying pressure needed to fuel a sustainable break. The reading is therefore borderline: the D1 pattern is technically clean, but the lack of dynamic confirmation and the conflict with the higher timeframe trend introduce considerable ambiguity.
Continuation: Directional Flow Assessment
The Continuation framework is assessed as not plausible for SUI/USDC at this time. The primary reason for this conclusion is the absence of a discernible directional trend on the daily timeframe, a core requirement for a 'Stable Directional Flow'. The D1 ADX reading of 10.43 is exceptionally low and points towards a ranging or non-directional market structure, where price has been consolidating between approximately 0.72 and 0.78 for over two weeks. This lack of directional momentum is further corroborated by a negative D1 Volume Oscillator (-28.29), suggesting that recent price movements lack strong market participation. Compounding this, the weekly context remains firmly bearish, with price trading significantly below its W1 EMA50 (1.47) and W1 EMA200 (1.74). The current daily price action is therefore best interpreted as a consolidation within a major downtrend rather than the basis for a new bullish leg. Structurally, price is facing immediate resistance at the D1 EMA50 (0.77) and the recent highs around 0.78, with the H1 micro-context showing recent weakness from this area. For the Continuation framework to become relevant, the market would need to establish a clear directional bias by breaking and holding above the 0.78 resistance, accompanied by a significant rise in the D1 ADX to confirm the emergence of a trend.

Comparative Framework Verdict
In this week's SUI weekly technical analysis, three distinct frameworks were assessed, revealing a clear hierarchy of plausibility. The market's current structure is dominated by a non-trending, range-bound state, making the Range/Rebound framework the most coherent and technically plausible scenario. This reading is strongly supported by the very low D1 ADX (10.43), which confirms the absence of a directional trend, and a well-defined support zone around 0.67-0.71 USDC. Considered secondary is the Breakout framework, which is rated as borderline. While a clear horizontal resistance has formed at 0.77-0.78 USDC, creating a textbook pre-breakout compression, this potential bullish move is challenged by the prevailing bearish trend on the weekly timeframe and a lack of confirmatory momentum on the daily chart. It represents a valid alternative but requires a significant shift in market dynamics to gain traction. Finally, the Continuation framework is deemed not plausible. The core requirement of a stable directional trend is fundamentally absent, as evidenced by the market's ranging behavior. Any bullish move from the current position would be a counter-trend action within a larger bearish context, not a continuation of an established flow. The key development to monitor will be whether price remains contained within its range, favoring the rebound scenario, or achieves a decisive close above 0.78 USDC, which would bring the breakout potential into focus.
For broader market context, readers can also review the latest related fundamental analysis for this pair.
For live market monitoring and the full interactive chart, readers can access the dedicated SUI Market Hub.
Disclaimer
CopyTradia provides technical analysis for informational and educational purposes only. This content does not constitute financial advice, investment recommendations, or trading signals. Cryptocurrency markets are highly volatile. Past performance is not indicative of future results. Always conduct your own research (DYOR) and consult a qualified financial advisor before making any investment decisions.


