SUI Range Rebound Analysis: Plausible Amid Consolidation

This SUI range rebound analysis examines the current SUI/USDC structure in the context of support defense and weakening alternative frameworks. SUI/USDC is currently defined by a period of technical consolidation, with price action contained within a well-defined horizontal range. Trading around the $0.75 mark, the pair shows a distinct lack of directional momentum, a condition strongly confirmed by a very low Daily ADX reading of 12.86. This suggests the market is in a state of equilibrium rather than a directional trend. The Daily RSI, positioned neutrally at 52.73, reinforces this picture of indecision. Price has spent the week oscillating between key structural levels at approximately $0.67 and $0.78. This technical consolidation aligns with the latest fundamental analysis, which highlights a market characterized by reduced realized volatility and a notable decrease in leveraged participation. This backdrop sets the stage for three distinct technical possibilities: a rebound within the established range, a potential breakout from the consolidation, or the eventual emergence of a new directional trend.

SUI Range Rebound Analysis: Support and Friction Zones
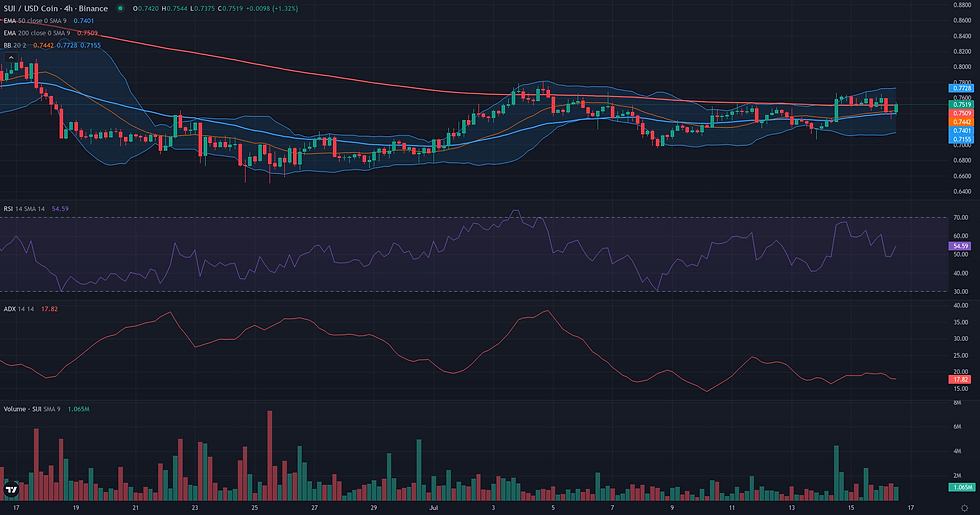
The resolution of the SUI/USDC range rebound framework hinges on the price maintaining its position above the D1 Bollinger middle band at 0.73, which serves as the equilibrium point for the current consolidation. This level is the critical validation zone for the rebound scenario. The framework would lose its coherence if the price fails to hold this support. A daily close below 0.73, which aligns with the D1 S2 pivot, would invalidate the immediate rebound thesis, shifting the balance of power back towards sellers and opening the door for a retest of the structural range low around 0.67. Before reaching for higher targets, the rebound must overcome a significant friction zone located between 0.75 and 0.77. This area represents a confluence of technical obstacles, including the 4H EMA 200, the daily pivot (0.76), and the first daily resistance level (0.77). The 4H price action already shows hesitation here, marking it as the first key battleground for buyers. If this resistance is cleared, the primary projection for a successful rebound is the top of the daily range at 0.78. This ceiling is heavily reinforced by the D1 Bollinger upper band, the D1 EMA 50, and the D1 R2 pivot, making it a formidable target. A secondary, more ambitious projection exists at the weekly R1 pivot of 0.80. Confirmation of the rebound's strength would be a sustained 4H break above 0.77, while a rejection from this friction zone would be a clear sign of weakening.

Breakout: Structural Catalyst Assessment
The market structure for SUI/USDC presents a classic but conflicted Breakout scenario, leading to a borderline assessment. On the daily timeframe, the technical picture is constructive for a potential breakout. Price has been consolidating for several weeks in a tight range, forming a horizontal base directly beneath a well-defined resistance ceiling at approximately 0.78. This level is reinforced by a confluence of technical indicators, including the upper Bollinger Band, the 20-day Donchian Channel, and the 50-day EMA. This period of compression is further evidenced by a significant drop in volume, as shown by a Volume Oscillator of -20.99%, and tightening volatility, suggesting a build-up of potential energy. However, this promising daily setup is severely constrained by a dominant bearish context on the weekly chart. Price is trading substantially below its major weekly moving averages (W1 EMA50 and EMA200), indicating a strong, established downtrend. The weekly RSI at 38.01 confirms this underlying weakness. Therefore, any bullish breakout on the daily chart would be a counter-trend move, facing significant structural headwinds. The lack of immediate directional momentum, with the daily ADX at a very low 12.86, further tempers enthusiasm, questioning whether there is sufficient force to sustain a break. The core tension lies between the clean D1 consolidation pattern and the hostile weekly trend, making the breakout framework technically present but highly conditional.

Continuation: Directional Flow Assessment
The Continuation framework is assessed as not plausible for SUI/USDC at this time. The primary reason for this conclusion is the market's current structural character on the daily timeframe, which lacks the necessary directional flow. For the past month, price has been contained within a consolidation range, oscillating between approximately 0.67 and 0.78 without establishing a clear, progressive trend. This lack of direction is quantitatively confirmed by the D1 ADX indicator, which stands at a very low 12.86, signaling a non-trending or range-bound environment. Furthermore, the D1 RSI at 52.73 is neutral, reflecting the current balance between buyers and sellers and the absence of decisive momentum. While the market has bounced from its June lows, this recovery has so far failed to evolve into a stable, impulsive structure that a continuation reading would require. For this framework to become relevant, the market would first need to resolve this period of indecision through a confirmed breakout above the range highs or a breakdown below its support, accompanied by a notable increase in directional energy.

Comparative Framework Verdict
Comparing the three technical frameworks, the SUI/USDC market structure most clearly supports the Range/Rebound scenario, which is assessed as plausible. This view is anchored in the extremely low Daily ADX of 12.86, which provides strong quantitative evidence of a non-trending, range-bound environment. The range itself is clearly delineated between support near $0.67 and resistance at $0.78, with the framework's validity hinging on the price holding above the equilibrium point at the D1 Bollinger middle band of $0.73. The Breakout framework is considered borderline. While it correctly identifies the D1 consolidation pattern as a potential launchpad for a significant move, its plausibility is weakened by the lack of directional momentum and the hostile context of the broader weekly downtrend. A breakout would be a counter-trend move requiring significant force that is not yet apparent. Finally, the Continuation framework is not plausible. Its core requirement—an existing, stable trend to follow—is absent. The market is defined by sideways movement, not directional progress. Therefore, the Range/Rebound framework offers the most coherent interpretation of the current price action. The key development to monitor will be whether price can overcome resistance near $0.78 or breaks below support at $0.67, and if the ADX begins to rise, signaling a potential end to this consolidation phase.
For broader market context, readers can also review the latest related fundamental analysis for this pair.
For live market monitoring and the full interactive chart, readers can access the dedicated SUI Market Hub.
Disclaimer
CopyTradia provides technical analysis for informational and educational purposes only. This content does not constitute financial advice, investment recommendations, or trading signals. Cryptocurrency markets are highly volatile. Past performance is not indicative of future results. Always conduct your own research (DYOR) and consult a qualified financial advisor before making any investment decisions.


