SUI Range Rebound Analysis: Support Holds, Price Stabilizes

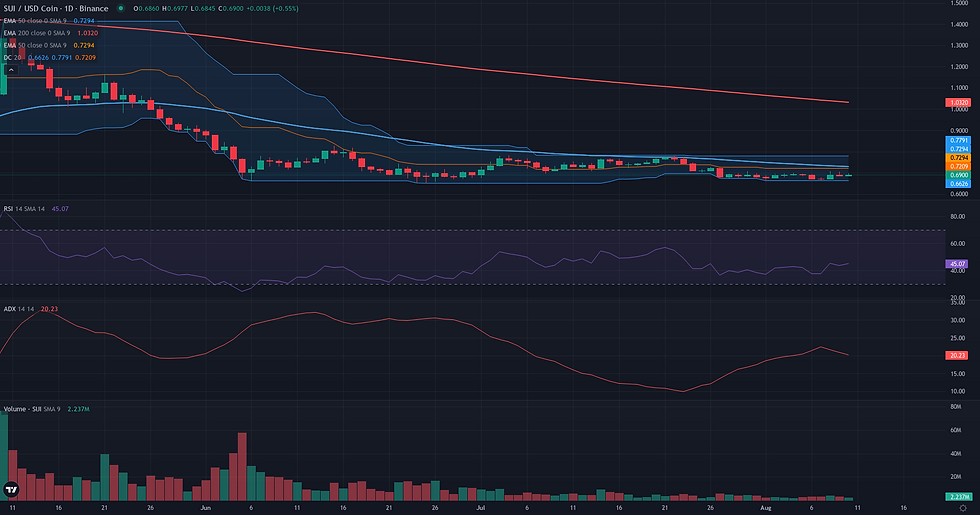
This SUI range rebound analysis examines the current SUI/USDC structure in the context of support defense and weakening alternative frameworks. SUI/USDC is currently navigating a period of technical consolidation, holding within a well-defined range after a protracted downtrend. With the price closing around 0.69 USDC, the market is contained within a narrow weekly band between 0.66 and 0.71. This price action reflects a state of indecision, which is technically supported by key indicators. The Daily RSI at 43.63 remains below the neutral 50 mark, signaling an absence of strong buying momentum, while the ADX at 21.74 confirms a weak or non-trending market environment. This technical consolidation aligns with the latest market analysis for the pair, which points to a cautious environment characterized by low volatility and consistent underperformance. The current structure suggests a pause in the prior bearish momentum, with the market testing a critical support floor as it awaits a new directional catalyst. The following analysis explores three potential frameworks based on this structure.

SUI Range Rebound Analysis: Support and Friction Zones
For the SUI/USDC pair, the range rebound framework pivots on the market's ability to clear the [0.70, 0.71] validation zone. This scenario is built upon a solid foundation of support established around the 0.66 USDC level, a price floor that has been successfully defended on multiple occasions over the past two months, as seen on both daily and weekly charts. The invalidation of this rebound attempt would be a structural breakdown, specifically a daily close below this critical 0.65-0.66 support cluster, which would signal a likely continuation of the broader downtrend. To gain traction, the rebound must overcome several technical hurdles. The first significant friction zone is located at 0.73 USDC, a confluence point where the daily 50-period EMA and the weekly R2 pivot converge. Beyond this, a more substantial historical resistance is visible around the 0.77-0.78 USDC area. If the price successfully navigates these obstacles, the primary projection for a full range rotation points towards the 0.80-0.83 USDC zone, which marks the highs from mid-June. Confirmation of the rebound's strength would come from a sustained move above the 0.71-0.73 resistance band. Conversely, a clear rejection from the current validation zone, pushing the price back towards the 0.66 support, would serve as a strong weakening signal, indicating the rebound is failing to materialize.


Breakout: Structural Catalyst Assessment
The Breakout framework is currently not plausible for SUI/USDC. The market structure is defined by a multi-week consolidation range, roughly between 0.66 and 0.78, which has formed within a dominant and ongoing weekly downtrend. For a bullish breakout to be considered, the price would need to show signs of compression and accumulation directly beneath the resistance ceiling around 0.78 (Donchian 20 D1 upper). However, the current price action contradicts this scenario. Price is trading near 0.69, closer to the range support at 0.66, and shows no immediate intent to challenge the upper boundary. This structural weakness is compounded by unsupportive momentum and volume readings. The daily RSI at 43.63 remains in bearish territory, and the price is trading well below key dynamic resistance levels like the EMA 50 D1 at 0.73. Furthermore, the negative Volume Oscillator (-12.09) indicates fading market participation, which is inconsistent with the energy build-up required for a powerful structural break. For this framework to become relevant, the market would first need to establish a clear structural shift, such as reclaiming the 0.73 level and building a sustained consolidation pattern directly against the 0.78 resistance zone, accompanied by expanding volume and rising momentum.
Continuation: Directional Flow Assessment
The Continuation framework is currently not plausible for SUI/USDC. The market structure lacks the necessary directional character, instead displaying a clear consolidation phase on the daily chart. Following a significant downtrend, price has entered a holding pattern, oscillating primarily between the recent weekly low of 0.66 and resistance around 0.71. This lack of directional progress is technically confirmed by a low D1 ADX reading of 21.74, which indicates a weak or non-existent trend. While the overarching weekly context remains bearish with price trading far below its key moving averages, the immediate downward momentum has stalled. The daily price action is constrained below significant resistance, including the D1 EMA 50 at 0.73 and the 4H EMA 200 at 0.71, but it is not actively continuing its descent. Instead, low volume and tight price action, particularly around the weekly pivot of 0.69, signal market indecision. For a Continuation framework to become relevant, the market would first need to establish a clear directional impulse, either by breaking decisively below the 0.66 support to resume the downtrend or by reclaiming key resistance levels to suggest a new structural bias.

Comparative Framework Verdict
Comparing the three technical frameworks, the Range/Rebound scenario emerges as the only plausible one for SUI/USDC in the current market structure. This framework accurately captures the price action of the past weeks, where a significant support base has been established around the 0.66 USDC level. This stabilization, supported by early signs of a short-term momentum shift on daily indicators, provides a coherent basis for a potential upward rotation within the existing range. For this scenario to develop, the price would need to successfully reclaim the immediate resistance zone identified between 0.70 and 0.71 USDC. In contrast, both the Breakout and Continuation frameworks are deemed not plausible. The Breakout scenario is invalid because the price is trading near the bottom of its range, not compressing against the upper resistance boundary required for a structural break. Similarly, the Continuation framework lacks relevance as the market is in a clear consolidation phase, confirmed by a low ADX reading, rather than exhibiting the directional momentum needed to continue the prior downtrend. Therefore, the immediate focus remains on the integrity of the 0.66 support and the market's ability to overcome the nearby 0.71 resistance, which will determine whether the current range holds or resolves.
For broader market context, readers can also review the latest related fundamental analysis for this pair.
For live market monitoring and the full interactive chart, readers can access the dedicated SUI Market Hub.
Disclaimer
CopyTradia provides technical analysis for informational and educational purposes only. This content does not constitute financial advice, investment recommendations, or trading signals. Cryptocurrency markets are highly volatile. Past performance is not indicative of future results. Always conduct your own research (DYOR) and consult a qualified financial advisor before making any investment decisions.


