SUI Continuation Analysis: Daily Bullish Structure Tested

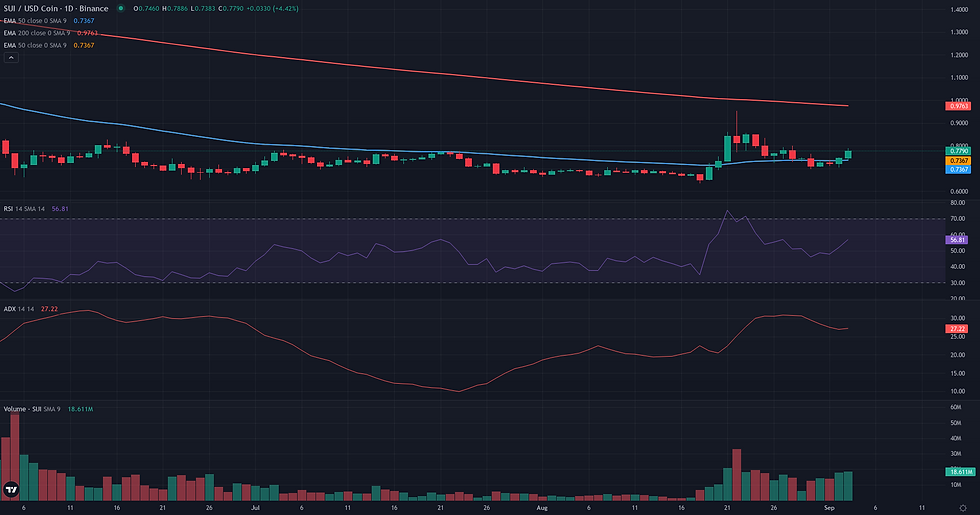
This SUI continuation analysis examines the current SUI/USDC structure in the context of support defense and weakening alternative frameworks. SUI/USDC is currently navigating a complex technical landscape, trading around the 0.75 level. The price has recently found support near the weekly low of 0.70 and reclaimed the 50-day EMA at 0.73, suggesting a potential recovery on the daily timeframe. Momentum indicators reflect this ambiguity, with a neutral D1 RSI of 51.90 indicating balance, while the D1 ADX at 27.10 points to some underlying trend strength. This daily price action, however, operates under the shadow of a bearish weekly structure, with price remaining significantly below key long-term moving averages. This technical picture of a daily correction is consistent with the latest fundamental analysis for SUI, which highlighted elevated volatility and deteriorating broader market sentiment following a recent price correction. The key question for the week ahead is whether the constructive daily setup can build momentum or if the prevailing weekly weakness will reassert control.

Range & Rebound Resolution: Support and Friction Zones
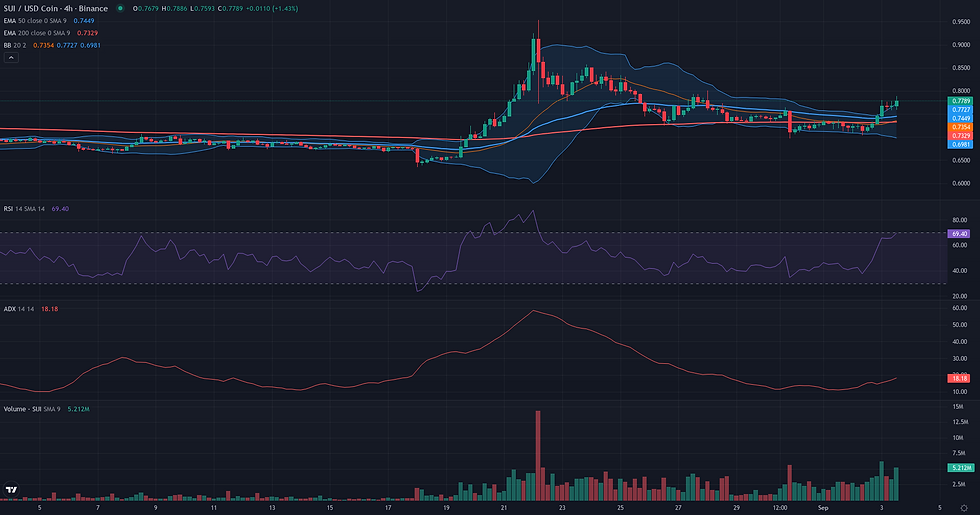
Following the borderline plausibility identified in the entry phase, the resolution of the SUI/USDC range rebound framework hinges on its ability to overcome key resistance levels. The validation zone, anchored between the 0.70 weekly low and the 0.73 level (D1 EMA 50), is currently holding, lending initial credibility to the rebound. The framework would lose its coherence and be invalidated if the price fails to defend this floor, marked by a daily close below the critical 0.70 support. For the rebound to confirm and gain traction, it must first navigate immediate friction zones. The price is currently challenging the D1 R2 pivot at 0.78, where short-term momentum could be tested. Beyond this, a more substantial structural obstacle awaits at the W1 R1 pivot of 0.81. Clearing this level is crucial for the framework's confirmation, as it would open a path towards the primary projection zone. This projection is defined by the 0.85 weekly high, which forms the upper boundary of the potential daily range. Conversely, a clear rejection from the current 0.78 resistance, followed by a drop below the 0.73 support, would serve as a weakening condition, signaling that the bounce is losing steam and a retest of the lows is likely. The resolution will ultimately depend on whether the constructive 4H momentum can overcome the structural resistance defined on the daily and weekly charts.

Breakout: Structural Catalyst Assessment
The Breakout framework is currently not plausible for SUI/USDC. While a powerful high-volume impulse in late August established a clear resistance ceiling at 0.95, the subsequent price action has failed to develop the necessary characteristics of a pre-breakout consolidation. Instead of coiling tightly beneath this level, the market experienced a sharp rejection, pulling back into the middle of its recent range. This lack of sustained pressure is corroborated by a neutral D1 RSI of 51.90, which signals a pause in momentum rather than an accumulation of buying interest. The primary limiting factor is the dominant weekly context, which remains structurally bearish. With price trading significantly below the W1 EMA50 at 1.31 and a weak W1 RSI of 40.19, any potential daily breakout would be fighting a strong higher-timeframe downtrend. For this framework to become relevant, the structure would need to change fundamentally, requiring a sustained period of consolidation and a decisive reclaim of the 0.85 resistance zone.

SUI Continuation Analysis: Directional Flow Assessment
The Continuation framework appears plausible for SUI/USDC, primarily based on a readable and constructive daily chart structure. The market recently printed a powerful bullish impulse, rising from 0.64 to 0.95 in mid-August. This was followed by an orderly pullback that appears to have found solid footing around the 0.70 level, which corresponds to the current weekly low. Critically, the price has now reclaimed and is holding above the confluence of the D1 EMA 50 and 4H EMA 200, both situated at 0.73. This defense of dynamic support, coupled with a D1 ADX of 27.10 indicating a trending environment, suggests the potential for a new upward leg. However, this bullish D1 scenario operates within a challenging weekly context. The asset remains in a long-term downtrend, trading significantly below key weekly moving averages like the W1 EMA 50 at 1.31. The W1 RSI at 40.19 reinforces this underlying weakness. The sharp rejection from the 0.95 high on the weekly timeframe highlights the presence of significant overhead supply. Despite this D1/W1 tension, the quality of the daily pullback and the successful test of key short-term supports provide a sufficient technical basis to consider the continuation scenario plausible.
Comparative Framework Verdict
In assessing the three technical frameworks for SUI/USDC, a clear hierarchy of plausibility emerges from the current market structure. The Continuation framework is identified as the most plausible scenario. This is based on a clean daily impulse-correction pattern, where a strong upward move was followed by a pullback that found support at the key 0.73 level (D1 EMA 50). This structure suggests the potential for another leg up, despite significant long-term weakness on the weekly chart. Considered secondary is the Range/Rebound framework, which is rated as borderline plausible. It correctly identifies the developing consolidation between the weekly low at 0.70 and the weekly high at 0.85. However, its plausibility is tempered by the same conflict that challenges the Continuation scenario: the tension between the nascent daily range and the dominant bearish weekly trend, which could limit the rebound's potential. Finally, the Breakout framework is deemed not plausible. The market has not established the necessary preconditions for a structural breakout, such as price compression and building momentum below a key resistance level. Instead, the price has pulled back significantly from its recent highs. The path forward will likely be determined by whether the market can hold the 0.73 support area to validate the daily bullish structure or if it succumbs to the overhead weekly resistance.
For broader market context, readers can also review the latest related fundamental analysis for this pair.
For live market monitoring and the full interactive chart, readers can access the dedicated SUI Market Hub.
Disclaimer
CopyTradia provides technical analysis for informational and educational purposes only. This content does not constitute financial advice, investment recommendations, or trading signals. Cryptocurrency markets are highly volatile. Past performance is not indicative of future results. Always conduct your own research (DYOR) and consult a qualified financial advisor before making any investment decisions.


