SUI Breakout Analysis: Momentum Challenges Weekly Resistance

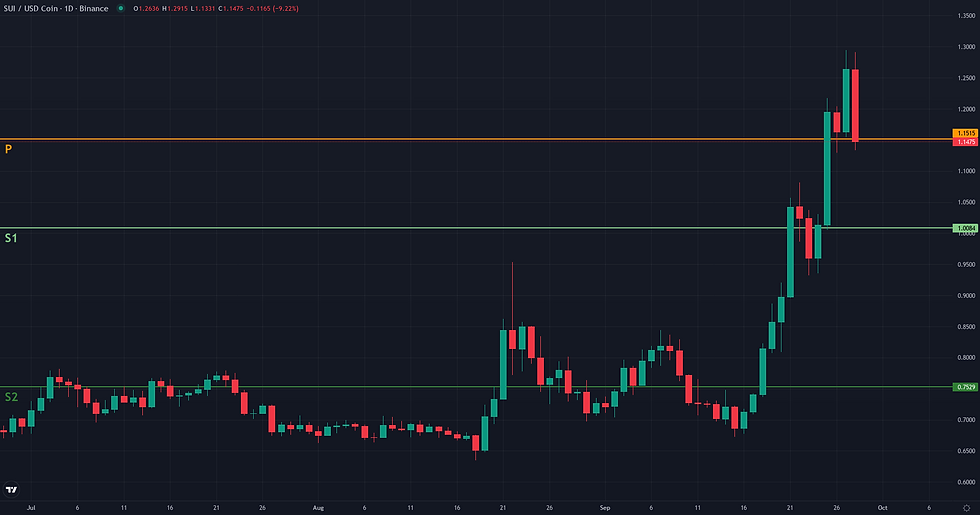
This SUI breakout analysis examines the current SUI/USDC structure in the context of support defense and weakening alternative frameworks. SUI/USDC is currently defined by a powerful bullish impulse, with the price having surged from a weekly low of $0.90 to test resistance near $1.29. This aggressive price action is supported by strong technical indicators on the daily timeframe. The ADX, at 37.57, confirms a robust and directional trend, while the RSI reading of 76.74 indicates significant, albeit overbought, momentum. Volatility remains elevated, with the daily NATR at 6.71%, reflecting the intensity of the recent move. While the price is trading comfortably above key daily moving averages, it is now directly confronting a significant higher-timeframe obstacle: the 50-period weekly EMA at $1.27. This technical structure, marked by a strong directional trend, aligns with the latest fundamental analysis which highlights elevated volatility and autonomous momentum driving the asset's recent outperformance. The current price level represents a critical inflection point where the strength of the daily trend is tested against major long-term resistance.
Range & Rebound: Market Structure Assessment
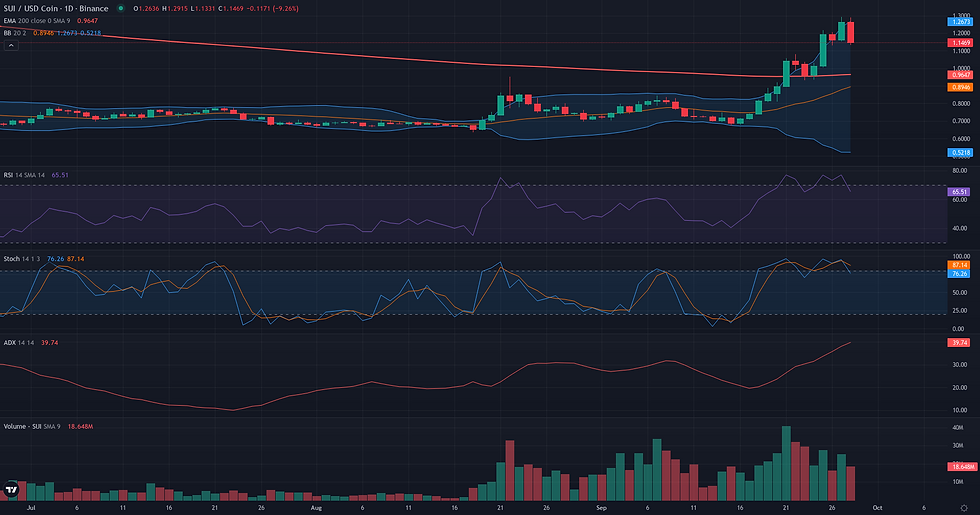
The Range/Rebound framework is not technically plausible in the current market context for SUI/USDC. The framework seeks signs of stabilization or a controlled reversal from a support level, whereas the current structure is defined by a powerful bullish breakout. The daily chart shows a strong directional trend, confirmed by an ADX of 37.57, well into trending territory. Momentum indicators are saturated, with the D1 RSI at 76.74 and Stochastics at 93.68, reflecting the intensity of the recent ascent rather than exhaustion or consolidation. Furthermore, the price is actively pushing above the upper Bollinger Bands on both the daily (1.23) and weekly (1.21) timeframes, a classic sign of trend acceleration, not range formation. For this framework to become relevant, the market would first need to end its current impulsive phase and establish a clear period of consolidation, allowing for the formation of a readable range with identifiable support and resistance levels.
SUI Breakout Analysis: Structural Catalyst Assessment
The Breakout framework appears plausible for SUI/USDC, driven by a powerful impulsive structure on the daily timeframe. The price has undergone a rapid ascent, culminating in a direct challenge of the 1.29 resistance, which corresponds to both the 20-day Donchian channel upper band and the current weekly high. This price action is not one of hesitant consolidation but of aggressive testing, with recent candles closing near their highs and trading above the upper Bollinger Band (1.23). The dynamic is strongly supported by momentum indicators; the ADX D1 at 37.57 confirms a robust trending environment, while the RSI D1 at 76.74, though in overbought territory, reflects the intensity of the current buying pressure. Furthermore, a positive Volume Oscillator (6.47) indicates that expanding volume is fueling the move. The primary limiting factor is the immediate proximity of the EMA 50 on the weekly chart, situated at 1.27. This higher-timeframe moving average represents a significant structural resistance. While this level introduces a notable point of friction, the sheer force and convergence of the daily signals make the breakout attempt the dominant technical narrative.

Continuation: Directional Flow Assessment
The market structure presents a compelling but conflicted case for a bullish continuation. On one hand, the daily chart displays a powerful and decisive uptrend, with price having broken out from its previous range with significant momentum. This directional flow is confirmed by a strong ADX D1 reading of 37.57 and price action well above all key daily moving averages. However, this bullishness is met with significant headwinds that temper the outlook. The daily RSI has entered overbought territory at 76.74, a classic sign of potential short-term exhaustion. More critically, the recent rally has pushed the price directly into a major weekly resistance level, the EMA 50 W1 at 1.27. The current pullback, visible on the H1 chart, from the 1.29 high down to the Weekly Pivot at 1.15, is therefore a crucial test. Whether this pullback resolves as a healthy consolidation above support or marks the start of a deeper correction in the face of major resistance is the central tension. This balance of a strong established trend against immediate and significant obstacles leads to a 'borderline' plausibility for the continuation framework.

Comparative Framework Verdict
Comparing the three technical frameworks, the market structure for SUI/USDC provides a clear hierarchy of plausibility. The Breakout framework emerges as the most dominant scenario. Its plausibility is rooted in the strong directional trend, evidenced by a high ADX reading and aggressive price action challenging the recent high of $1.29. This view is further supported by expanding volume, suggesting conviction behind the move. A sustained daily close above this level would serve as confirmation for this framework. Rated as borderline, the Continuation framework serves as the secondary scenario. It correctly captures the central tension in the market: the powerful daily uptrend clashing with significant weekly resistance at the 50-period EMA ($1.27) and overbought momentum indicators. This framework suggests a potential for a temporary pullback or consolidation, identifying the $1.15 - $1.20 zone as a key area of support to monitor. A successful defense of this zone would keep the broader uptrend intact. Finally, the Range/Rebound framework is deemed not plausible. The market's characteristics—a strong ADX, overbought RSI, and price pushing against the upper Bollinger Bands—are antithetical to the conditions required for a range-bound or reversal scenario. The key element to watch going forward is the resolution at the $1.27-$1.29 resistance zone, which will determine whether an immediate breakout occurs or if a period of consolidation is necessary first.
For broader market context, readers can also review the latest related fundamental analysis for this pair.
For live market monitoring and the full interactive chart, readers can access the dedicated SUI Market Hub.
Disclaimer
CopyTradia provides technical analysis for informational and educational purposes only. This content does not constitute financial advice, investment recommendations, or trading signals. Cryptocurrency markets are highly volatile. Past performance is not indicative of future results. Always conduct your own research (DYOR) and consult a qualified financial advisor before making any investment decisions.


