SUI Breakout Analysis: Price Consolidates Under $1.29

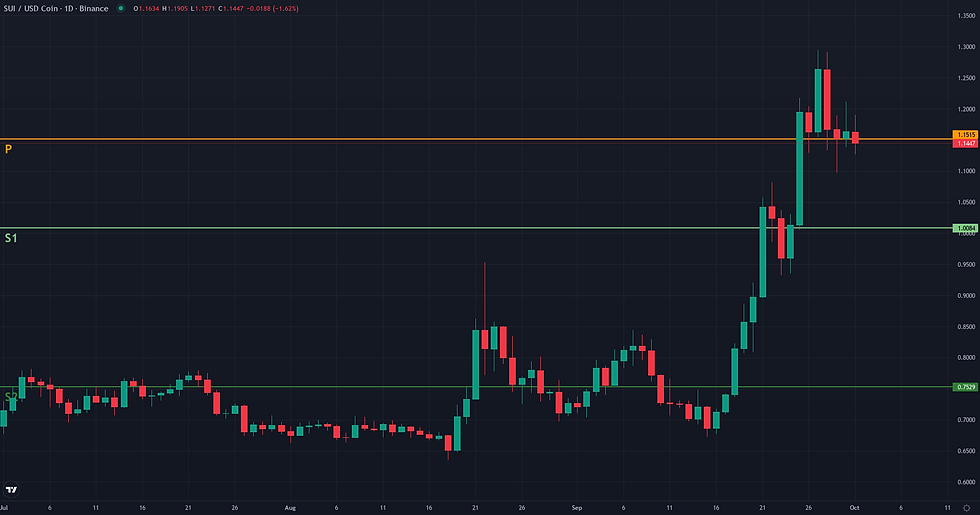
This SUI breakout analysis examines the current SUI/USDC structure in the context of support defense and weakening alternative frameworks. SUI/USDC is currently in a phase of high-momentum consolidation following a powerful rally. The daily chart shows the price holding at $1.16, well above key moving averages like the D1 EMA 200 at $0.90, after establishing a recent high at $1.29. The market's directional strength is confirmed by a high ADX reading of 40.81 and a bullish RSI of 66.25, indicating that the underlying uptrend remains firmly intact. This technical picture of a strong, trending asset aligns with recent observations of elevated volatility and expanding open interest, which suggest a significant increase in market participation. The current price action represents a pause or absorption phase beneath a key resistance level, setting the stage for a potential test of new highs or a continuation of the broader trend after this consolidation resolves.
Range & Rebound: Market Structure Assessment
The Range/Rebound framework is assessed as not plausible for SUI/USDC at this time due to a fundamental mismatch with the prevailing market structure. This framework is designed to identify stabilization and potential reversals near established support levels, typically following a corrective phase or within a defined range. The current context, however, is characterized by a strong, directional uptrend. The daily chart shows a powerful bullish impulse that has carried the price from below 0.70 to a recent high of 1.29. This momentum is confirmed by a high D1 ADX reading of 40.81, which signals a robust trending environment, the opposite of the stabilization sought by this framework. Furthermore, price is currently consolidating near its recent peak, trading significantly above key structural levels like the D1 EMA 200 (0.90) and the D1 Bollinger middle band (0.94). The weekly chart reinforces this bullish outlook, with the last candle closing at 1.26 after breaking above the weekly upper Bollinger Band (1.21), a sign of significant strength. For the Range/Rebound framework to become relevant, the market would first need to undergo a structural shift, such as a significant correction towards a support zone like the 1.01 pivot or the 0.90 area, coupled with a clear deceleration of the current bullish momentum.

SUI Breakout Analysis: Structural Catalyst Assessment
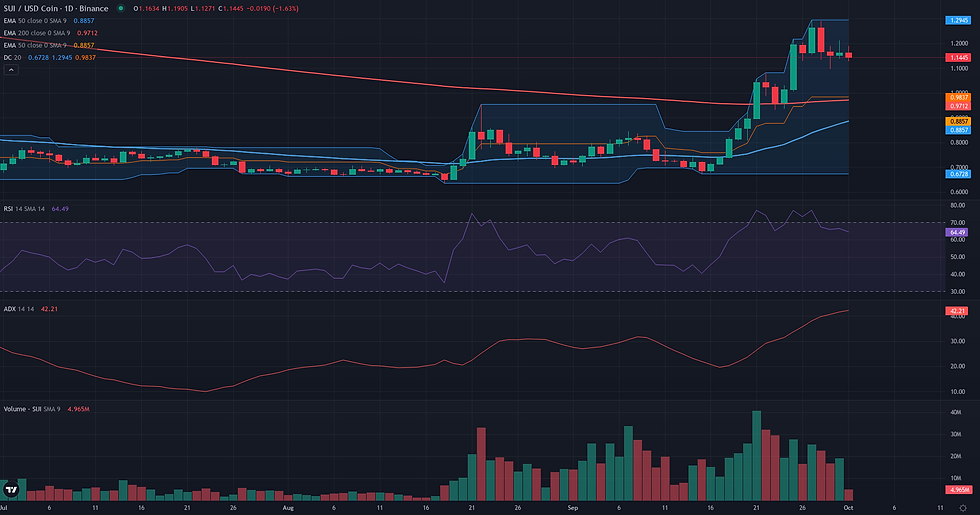
The Breakout framework appears technically plausible for SUI/USDC. The market structure is characterized by a strong bullish trend that has culminated in a consolidation phase just below a critical resistance zone around 1.29. This level is not arbitrary; it is defined by the Donchian 20 D1 upper band and the highs of the past week, and its significance is magnified by its confluence with the weekly 50-period EMA at 1.27. This convergence of daily and weekly technical elements creates a formidable ceiling, where a decisive breach would be a significant structural event. The underlying dynamics support this potential, with the ADX D1 at a high value of 40.81 confirming a powerful trend, and the RSI at 66.25 indicating strong but not yet overextended momentum. The only minor point of ambiguity is a negative Volume Oscillator, though this often characterizes a constructive pause as supply is absorbed before a potential continuation. Overall, the structure presents a coherent narrative of energy being built up beneath a key technical barrier.
Continuation: Directional Flow Assessment
The technical structure for SUI/USDC presents a plausible continuation scenario. The daily chart displays a strong and orderly uptrend that originated from the 0.67 level in mid-September and culminated in a recent high of 1.29. This directional move is supported by a high D1 ADX of 40.81, indicating a robust trending market, while the D1 RSI at 66.25 confirms strong but not yet overextended bullish momentum. This daily structure is reinforced by the weekly context, which recently printed a powerful breakout candle, pushing the price above its multi-week range and holding above the weekly pivot point at 1.15. Following the peak at 1.29, the price has entered a consolidation phase over the last few sessions. This pullback appears constructive, as it is occurring on declining volume (D1 Volume Oscillator: -3.83), which typically suggests a temporary pause rather than a reversal. The price remains well-supported by its key moving averages, such as the D1 EMA50 at 0.88. While the H1 micro-chart shows some short-term selling pressure, this is consistent with a higher-timeframe consolidation and does not, at this stage, invalidate the dominant bullish structure.

Comparative Framework Verdict
Of the three technical frameworks analyzed for SUI/USDC, two present plausible scenarios while one is clearly invalidated by the current market structure. The Breakout framework emerges as the most dominant, as it accurately captures the immediate market dynamic: a tight consolidation phase occurring directly below the well-defined resistance at $1.29. This level represents a significant structural barrier, and the current price action suggests an absorption of selling pressure in a strongly trending environment. Also assessed as plausible, the Continuation framework provides a broader, yet secondary, perspective. It correctly identifies the robust underlying uptrend, supported by a high ADX and price action well above key moving averages, framing the current pause as a healthy pullback. Conversely, the Range/Rebound framework is deemed not plausible. Its premise of stabilization near a support level is fundamentally at odds with the current market, which is characterized by a powerful, directional uptrend rather than a correction. The key technical question for the coming sessions is the resolution of the consolidation below $1.29. A sustained move above this level would validate the breakout thesis, while a rejection could lead to a deeper test of support within the broader continuation structure.
For broader market context, readers can also review the latest related fundamental analysis for this pair.
For live market monitoring and the full interactive chart, readers can access the dedicated SUI Market Hub.
Disclaimer
CopyTradia provides technical analysis for informational and educational purposes only. This content does not constitute financial advice, investment recommendations, or trading signals. Cryptocurrency markets are highly volatile. Past performance is not indicative of future results. Always conduct your own research (DYOR) and consult a qualified financial advisor before making any investment decisions.


