Solana Weekly Range Rebound: Consolidation Holds

This Solana weekly range rebound examines the current SOL/USDC structure in the context of support defense and weakening alternative frameworks. SOL/USDC is currently defined by a distinct loss of directional momentum, leading to a tight consolidation phase on the daily chart. The market is in a state of equilibrium, with the price hovering just above its 50-day exponential moving average at 75.45 USDC. This lack of trend is quantitatively confirmed by a very low D1 ADX reading of 11.33, while the D1 RSI at 52.24 reflects neutral momentum. This technical picture of stabilization aligns with the latest fundamental analysis, which highlighted a 'significantly subdued volatility environment' for the pair. The price action is contained within the week's range of 71.91 to 77.80, a structure that sits within a broader, bearish weekly context. This sets the stage for a technical analysis focused on whether this consolidation will resolve as a rebound from support or an eventual continuation of the underlying downtrend.
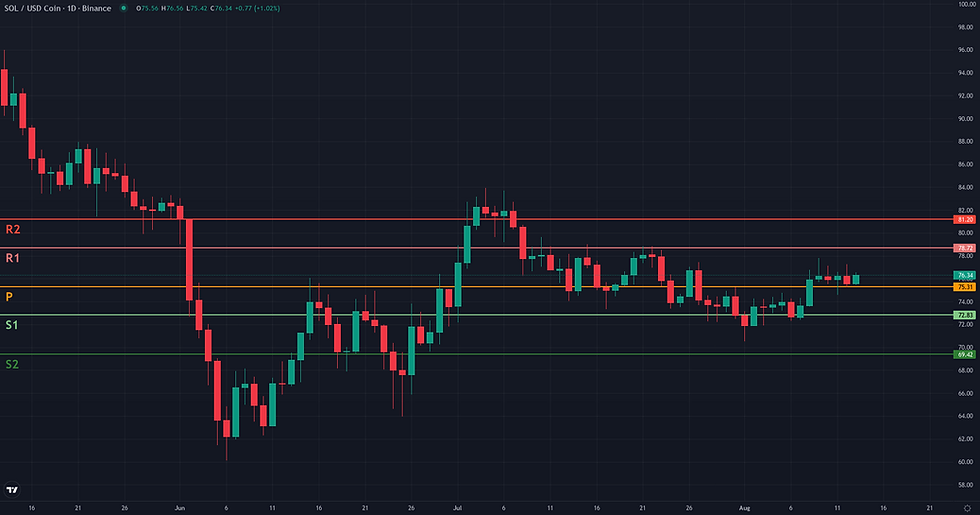
Solana Weekly Range Rebound: Support and Friction Zones
Following the plausible range rebound framework identified in the 70.50 - 72.85 USDC validation zone, the resolution path presents a series of well-defined technical hurdles. The framework's coherence hinges on defending the key support at 70.53 USDC, the 30-day low. A daily close below this level would invalidate the stabilization, likely signaling a continuation of the broader bearish trend. Currently, the price is navigating a critical pivot area defined by the D1 EMA 50 at 75.45 and the weekly pivot at 75.31. A failure to establish a foothold here would be the first sign of weakness. Should the rebound persist, the primary obstacle is the upper boundary of the daily range, a resistance cluster between 77.50 and 78.00 USDC. This zone has capped previous rallies and represents a significant test for buyers. A decisive breakout above this ceiling would confirm the rebound's strength, opening a path towards higher structural references. The first technical projection is the weekly R1 pivot at 78.72. Beyond that, a more significant target zone lies between the weekly R2 pivot at 81.20 and the highs from early July around 83.00. Confirmation of the rebound requires a sustained move above the 78.00 resistance, while a rejection from this level and a drop back below the D1 EMA 50 would indicate the rebound is losing momentum, placing the validation zone back under pressure.


Breakout: Structural Catalyst Assessment
The Breakout framework is currently not plausible for SOL/USDC. While the daily chart displays a recognizable horizontal structure with a resistance ceiling established around the 77.80 level (Donchian 20 D1 upper), the essential dynamic for a structural break is absent. The primary contradiction lies in the complete lack of directional momentum, highlighted by a critically low D1 ADX of 11.33. This value indicates a listless, non-trending market, which is the antithesis of the energy accumulation required for a breakout. The neutral D1 RSI at 52.24 further corroborates this state of equilibrium without suggesting any underlying pressure. Zooming out, the weekly context provides significant headwinds; the W1 RSI at 40.69 signals underlying weakness, and the price remains substantially below key weekly moving averages, reinforcing a broader bearish to neutral bias. For the Breakout framework to become relevant, a fundamental shift in market dynamics would be required, starting with a clear resurgence in directional momentum on the daily timeframe and a stabilization of the weekly structure.

Continuation: Directional Flow Assessment
The Continuation framework is not retained for SOL/USDC this week as the market structure does not exhibit the required 'Stable Directional Flow'. The primary reason for this assessment is the clear absence of a trend on the daily timeframe. This is quantitatively confirmed by the D1 ADX indicator, which registers a very low value of 11.33, signaling a non-directional and range-bound market environment. The recent price action, characterized by choppy, sideways movement, supports this reading. While the price is currently holding above the D1 EMA 50 (75.45) and the weekly pivot (75.31), this merely indicates a state of local equilibrium rather than directional momentum. Furthermore, this consolidation is occurring within a broader bearish weekly context, with price trading significantly below its major weekly moving averages. For the Continuation framework to become relevant, the market would first need to establish a new directional impulse, for example by breaking and holding above the recent weekly high of 77.80, accompanied by a D1 ADX rising above the 20-25 threshold to confirm the emergence of a trend.

Comparative Framework Verdict
The comparative analysis of the three technical frameworks for SOL/USDC reveals a clear and unambiguous conclusion: the market is currently in a range-bound, non-directional state. Consequently, the Range/Rebound framework is the only scenario considered plausible this week. It accurately captures the price action consolidating within a well-defined support zone between 70.50 and 72.85 USDC and a resistance ceiling near 78.00. The very low D1 ADX reading of 11.33 provides the primary validation for this framework, signaling a distinct absence of any directional trend. In contrast, both the Breakout and Continuation frameworks are deemed not plausible. Their core premises—either building momentum for a structural break or the continuation of an existing trend—are directly contradicted by the market's current state of equilibrium. While the daily range is clear, it is important to note it has formed within a broader weekly downtrend, which could limit the upside potential of any rebound. The key element to monitor going forward will be the market's reaction at the boundaries of this range. A sustained break of either support or resistance, accompanied by a sharp rise in the D1 ADX, would signal the end of this stabilization phase.
For broader market context, readers can also review the latest related fundamental analysis for this pair.
For live market monitoring and the full interactive chart, readers can access the dedicated SOL Market Hub.
Disclaimer
CopyTradia provides technical analysis for informational and educational purposes only. This content does not constitute financial advice, investment recommendations, or trading signals. Cryptocurrency markets are highly volatile. Past performance is not indicative of future results. Always conduct your own research (DYOR) and consult a qualified financial advisor before making any investment decisions.


