Solana Weekly Breakout Analysis: SOL Consolidates Near Highs as Trend Strength Persists

This Solana weekly breakout analysis examines the current SOL/USDC structure in the context of support defense and weakening alternative frameworks. SOL/USDC is currently in a phase of high-level consolidation, trading around 121.58 after a powerful uptrend. The market structure is defined by significant underlying strength, evidenced by a very high daily ADX of 43.48, which signals a robust and established directional trend. Momentum remains firmly bullish, with the daily RSI at 66.31, indicating strength without being in extreme overbought territory. This technical picture of a pause within a strong trend aligns with recent fundamental observations, which noted a period of significantly reduced volatility and internal re-evaluation for the asset. The price is currently contained within last week's range of 116.30 to 123.73, creating a state of compression. This sets the stage for analyzing the potential resolution of this sideways price action, as the market decides whether to resume its prior trajectory or undergo a more significant structural change.
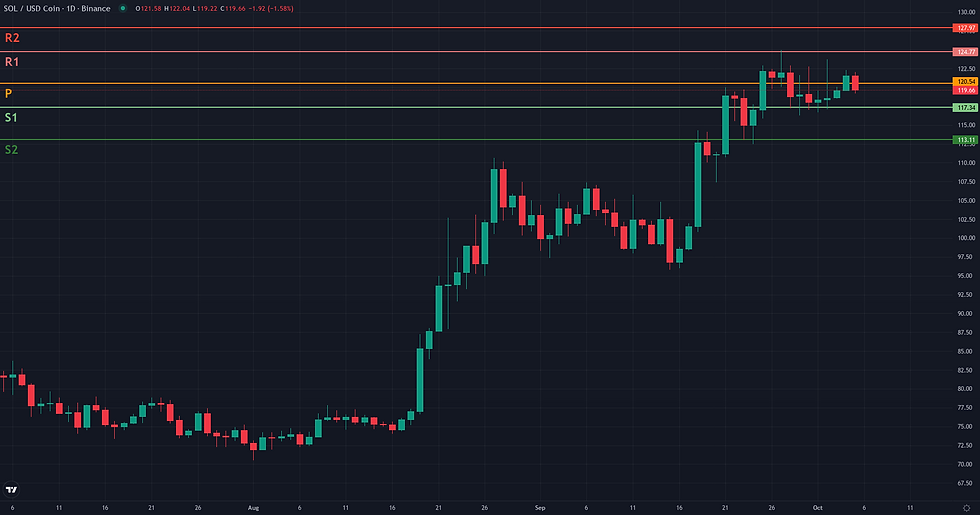
Range & Rebound: Market Structure Assessment
The Range/Rebound framework is assessed as not plausible for the current market structure. The primary reason for this conclusion is the overwhelming evidence of a strong, established uptrend, which directly contradicts the framework's requirement for stabilization or trend exhaustion. The daily ADX reading of 43.48 is exceptionally high, indicating that the trend is powerful and directional, not consolidating. This is further corroborated on the weekly timeframe, where the price is actively trading above the upper Bollinger Band at 119.97, a condition typically associated with trend continuation and strength rather than reversal or ranging. While a negative D1 Volume Oscillator (-33.44) hints at potentially weakening participation, this single signal is insufficient to challenge the powerful structural and momentum indicators. The current price action is best described as a pause at multi-month highs, not a rebound from a support level. For the Range/Rebound framework to become relevant, the market would first need to demonstrate a clear cessation of this trend, likely through a break of recent support around 116.30 and a significant decline in the ADX.

Solana Weekly Breakout Analysis: Structural Catalyst Assessment
The Breakout framework appears technically plausible for SOL/USDC, based on a constructive consolidation pattern that has formed over the last ten sessions. The price structure is currently coiling directly beneath a significant resistance ceiling located around 124.77-124.95. This zone represents a clear confluence of the 20-day Donchian channel upper band (124.95) and the weekly R1 pivot point (124.77). The technical context is supportive of a potential continuation, as the market is in a powerful, established uptrend confirmed by a D1 ADX reading of 43.48. Momentum, measured by the D1 RSI at 66.31, remains strong without being excessively overbought, suggesting further upside capacity. Furthermore, the D1 Volume Oscillator is negative (-33.44), indicating that volume has decreased during this sideways phase, a classic sign of energy accumulation before a potential expansion. While the overall structure is favorable, any successful breakout would quickly face the long-term W1 EMA 200 at 130.35, which could serve as a significant point of friction.
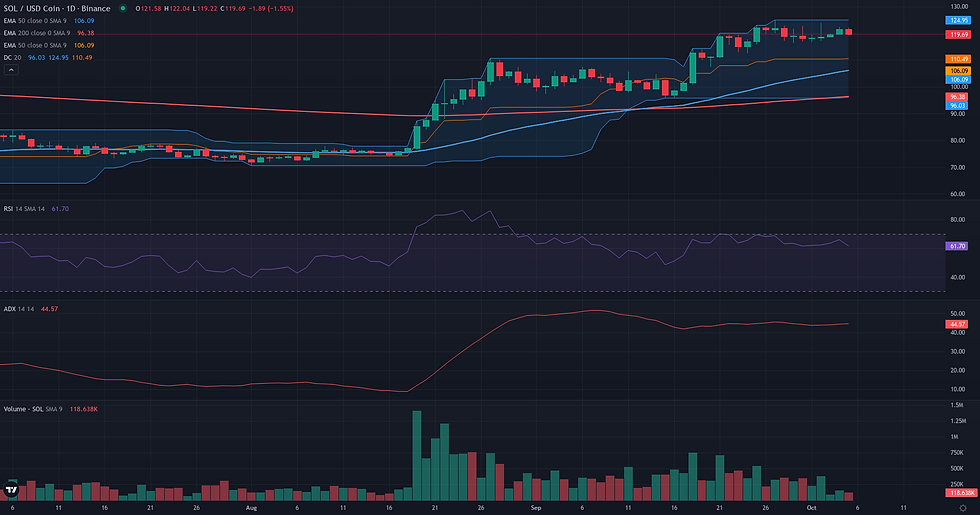
Continuation: Directional Flow Assessment
The technical structure for SOL/USDC presents a plausible case for a bullish continuation. The asset has established a strong and coherent uptrend on both the daily and weekly timeframes, a key characteristic of the Stable Directional Flow signature. On the daily chart, the trend's strength is confirmed by a high ADX reading of 43.48, with price action consistently holding above the D1 EMA 50 (105.23). This directional bias is reinforced by the weekly chart, which shows price firmly above its own W1 EMA 50 (106.63) and a strong RSI of 66.81. Following a significant impulse wave that peaked near 124.95, the price has entered a consolidation phase. This pause appears constructive, as it is occurring on lower relative volume (D1 Volume Oscillator: -33.44) and is holding above key short-term structural supports, including the weekly low of 116.30. However, two factors warrant caution. Firstly, the market is approaching a significant long-term resistance level at the W1 EMA 200 (130.35), which may temper the advance. Secondly, the immediate H1 timeframe shows some bearish pressure, though this has yet to impact the broader daily structure. Overall, the balance of evidence supports the continuation framework, contingent on the integrity of the current consolidation structure.
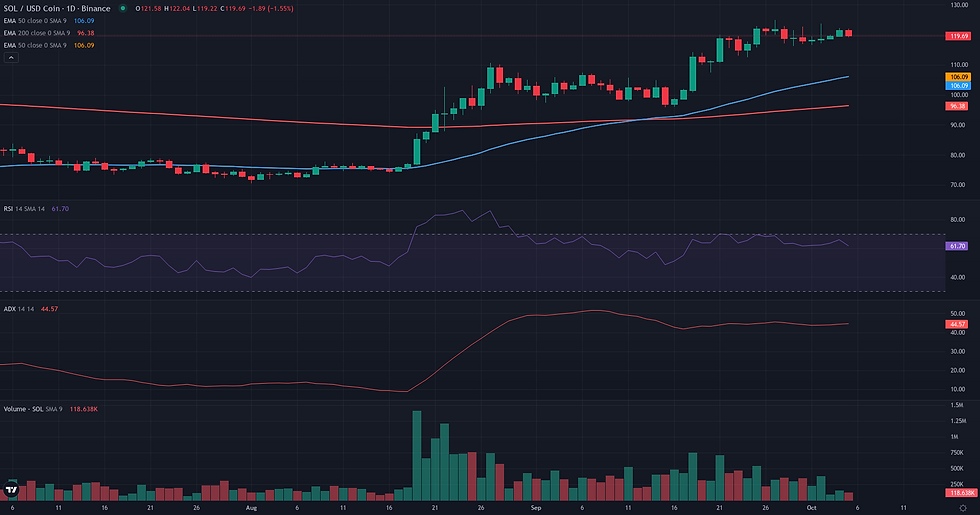
Comparative Framework Verdict
Comparing the three technical frameworks, a clear directional bias emerges, with both bullish scenarios presenting a coherent case while the range-bound scenario is invalidated by current market conditions. The Breakout framework is assessed as the most dominant. It is deemed plausible due to the clear consolidation pattern forming just beneath the key resistance zone around 124.95. This structure is supported by a powerful underlying trend (D1 ADX at 43.48) and contracting volume, classic signs of energy accumulation before a potential upward expansion. Closely aligned is the Continuation framework, which serves as a strong secondary perspective. Also rated plausible, it focuses on the integrity of the current pause, validated by price holding above the 116.30 - 117.34 support floor. This view complements the breakout scenario by defining the structural support that must hold for the bullish thesis to remain intact. In direct contrast, the Range/Rebound framework is considered not plausible. The extremely high ADX reading directly contradicts the conditions required for a ranging market, making this the weakest of the three scenarios. Looking ahead, the key technical development will be the resolution of this consolidation, with any successful bullish move likely to encounter significant long-term resistance at the weekly EMA 200 near 130.35.
For broader market context, readers can also review the latest related fundamental analysis for this pair.
For live market monitoring and the full interactive chart, readers can access the dedicated SOL Market Hub.
Disclaimer
CopyTradia provides technical analysis for informational and educational purposes only. This content does not constitute financial advice, investment recommendations, or trading signals. Cryptocurrency markets are highly volatile. Past performance is not indicative of future results. Always conduct your own research (DYOR) and consult a qualified financial advisor before making any investment decisions.


