Solana Range Rebound Analysis: Support Holds in Consolidation

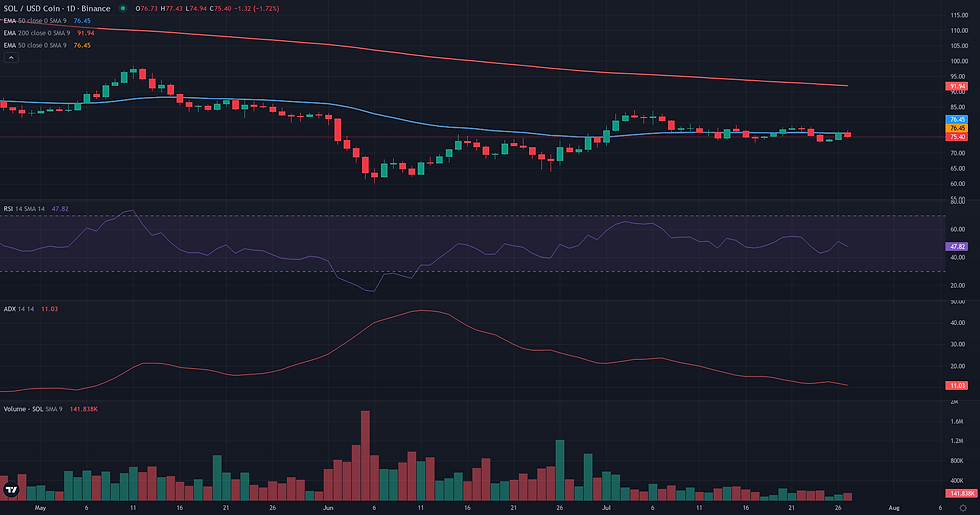
This Solana range rebound analysis examines the current SOL/USDC structure in the context of support defense and weakening alternative frameworks. SOL/USDC is currently defined by a distinct consolidation phase on the daily timeframe, with price action contained within a well-established range. The market's lack of directional conviction is technically confirmed by a very low D1 ADX reading of 11.88, while the D1 RSI sits at a neutral 51.49. This technical equilibrium aligns with recent market analysis indicating reduced volatility and a contraction in leveraged positioning, suggesting a period of low conviction from market participants. Price is currently navigating around the D1 50-period moving average at $76.49, having recently tested support near the weekly low of $73.39. This daily stabilization, however, exists within a broader weekly context that remains weak, with the W1 RSI below 50 and price trading significantly under key long-term moving averages. The current structure presents a tension between short-term balance and longer-term bearish pressure, setting the stage for analyzing potential range-bound, breakout, or continuation scenarios.
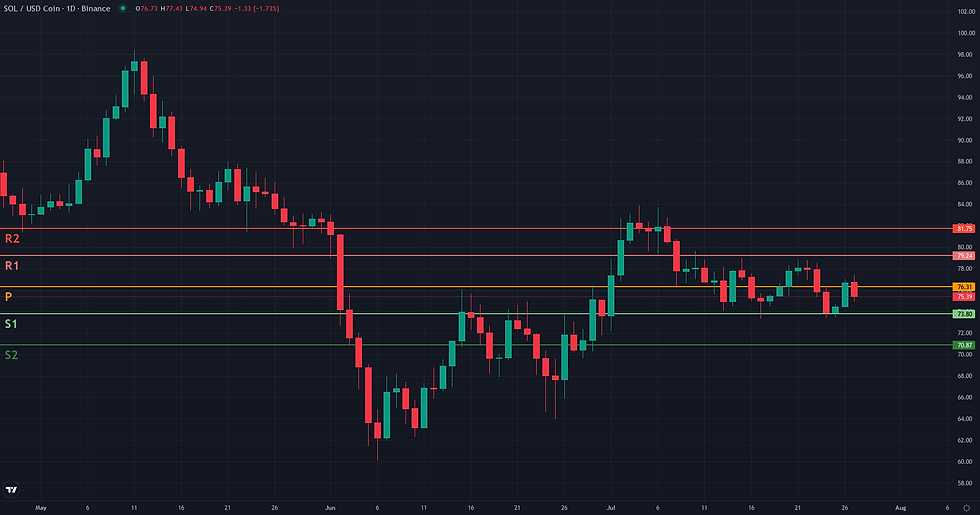
Solana Range Rebound Analysis: Support and Friction Zones
The Range/Rebound framework for SOL/USDC is resolving from its validation zone of 73.40 - 73.80. The market has confirmed the relevance of this support by posting a low at 73.39 and subsequently bouncing. The price is now at a critical decision point, testing the D1 50 EMA at 76.49 and holding just above the weekly pivot at 76.31. This area represents the first major test for the rebound's viability. The framework would lose its coherence if the support fails. A confirmed daily close below 73.40 would constitute a structural breakdown, invalidating the rebound scenario and suggesting a potential resumption of the broader downtrend. For the rebound to gain traction, it faces several friction zones. The immediate hurdle is the current 76.50 - 76.75 area. Overcoming this would open the path to a more significant resistance cluster between 78.50 and the Weekly R1 pivot at 79.24. This upper band represents the top of the immediate D1 consolidation range. If the framework confirms by breaking through these friction zones, its primary technical projection is the area around the W1 R1 pivot (79.24). A more extended move could target the next structural level, marked by the W1 R2 pivot at 81.75. Confirmation of the rebound's strength would involve a sustained hold above the D1 50 EMA, while a rejection from this level would be a significant weakening signal, likely pushing the price back toward the 73.40 support for another test.
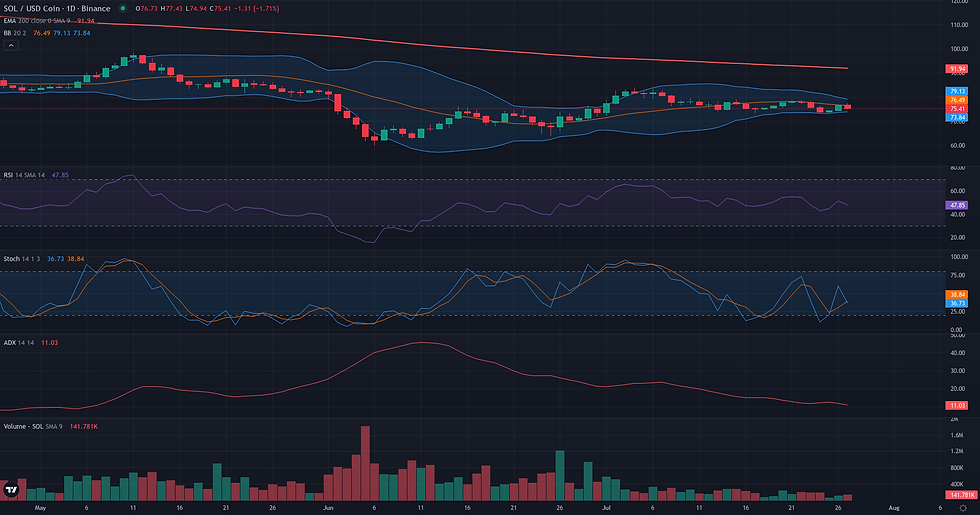
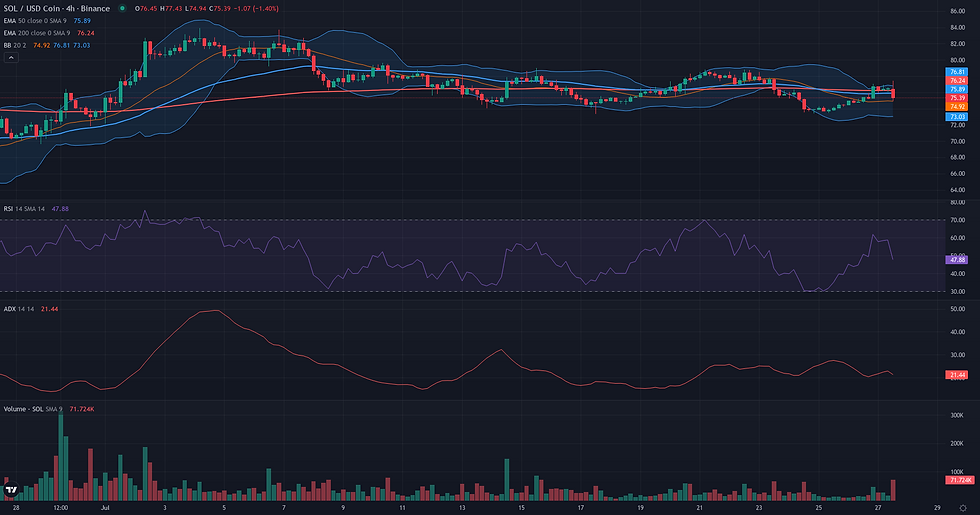
Breakout: Structural Catalyst Assessment
The technical structure for SOL/USDC presents a classic but conflicted scenario for a potential breakout. On the daily timeframe, the market has established a well-defined consolidation range over the past three weeks, oscillating primarily between the support at 73.32 and the resistance at 82.74, as marked by the Donchian 20 D1 channel. This period of equilibrium is confirmed by a very low ADX D1 reading of 11.88, which often precedes a significant directional move. This structural compression forms the basis for considering a breakout framework. However, this potential setup is significantly challenged by two factors. Firstly, the immediate momentum and volume dynamics on the daily chart are unconvincing. The RSI D1 is neutral at 51.49 and the Volume Oscillator is negative (-35.70), indicating a lack of preparatory buying pressure needed to fuel a sustainable break. Secondly, and more critically, the weekly context remains firmly bearish. With price trading substantially below its key weekly moving averages and a weak W1 RSI of 40.11, any bullish breakout on the daily chart would be a counter-trend move, facing considerable headwinds. This tension between the clear D1 range structure and the opposing weekly trend places the framework in a borderline category, where the potential for a structural break is identifiable but its viability is questionable without stronger momentum confirmation.
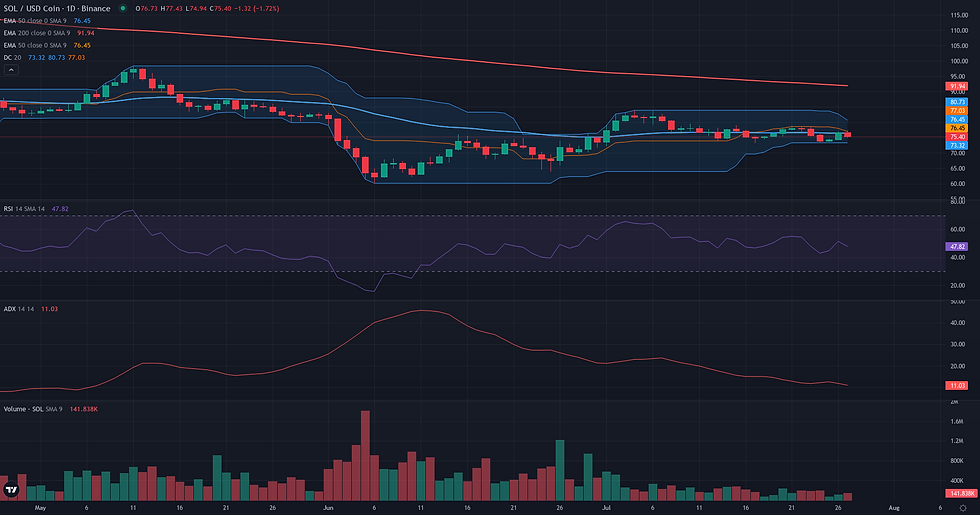
Continuation: Directional Flow Assessment
The Continuation framework is assessed as not plausible for SOL/USDC at this time. The primary reason for this verdict is the absence of a clear directional trend on the daily timeframe, a core requirement for a continuation scenario. The market structure is best described as a multi-week consolidation, a state strongly corroborated by a D1 ADX reading of 11.88, which signals a distinct lack of directional momentum. While the price is currently testing the D1 EMA50 (76.49), this action is occurring within a broader bearish weekly context. On the W1 chart, price remains significantly below key long-term moving averages, and the W1 ADX (31.70) confirms that the dominant, higher-timeframe trend remains to the downside. The lack of conviction is further underscored by a negative D1 Volume Oscillator (-35.70). For this framework to become relevant, the market would first need to establish a clear directional bias, likely confirmed by a breakout from the recent range (e.g., above the 78.83 weekly high) and a corresponding rise in the D1 ADX above the 20-25 threshold.
Comparative Framework Verdict
Comparing the three technical frameworks, the Range/Rebound scenario emerges as the most plausible. This view is strongly supported by the market's current state of equilibrium, evidenced by an extremely low D1 ADX (11.88) and price action contained within clear structural boundaries. The framework identifies a robust support zone around $73.40 - $73.80, which has so far held, providing a coherent basis for a potential rebound within the established range. The Breakout framework is considered borderline. While the prerequisite of a clear consolidation range is met, the scenario is weakened by a lack of preparatory momentum. The neutral D1 RSI and negative volume oscillator do not suggest the buildup of pressure needed for a sustainable break. Furthermore, any bullish breakout would be a counter-trend move against the weaker weekly chart structure, facing significant technical headwinds. Finally, the Continuation framework is assessed as not plausible. The core requirement for this scenario is an existing directional trend to continue, which is fundamentally absent on the daily timeframe. The low ADX reading directly contradicts the conditions needed for a continuation. Therefore, the dominant technical narrative for SOL/USDC is one of range-bound activity, and a significant increase in directional momentum would be required to alter this assessment.
For broader market context, readers can also review the latest related fundamental analysis for this pair.
For live market monitoring and the full interactive chart, readers can access the dedicated SOL Market Hub.
Disclaimer
CopyTradia provides technical analysis for informational and educational purposes only. This content does not constitute financial advice, investment recommendations, or trading signals. Cryptocurrency markets are highly volatile. Past performance is not indicative of future results. Always conduct your own research (DYOR) and consult a qualified financial advisor before making any investment decisions.


