Solana Range Rebound Analysis: Breakout Potential Builds

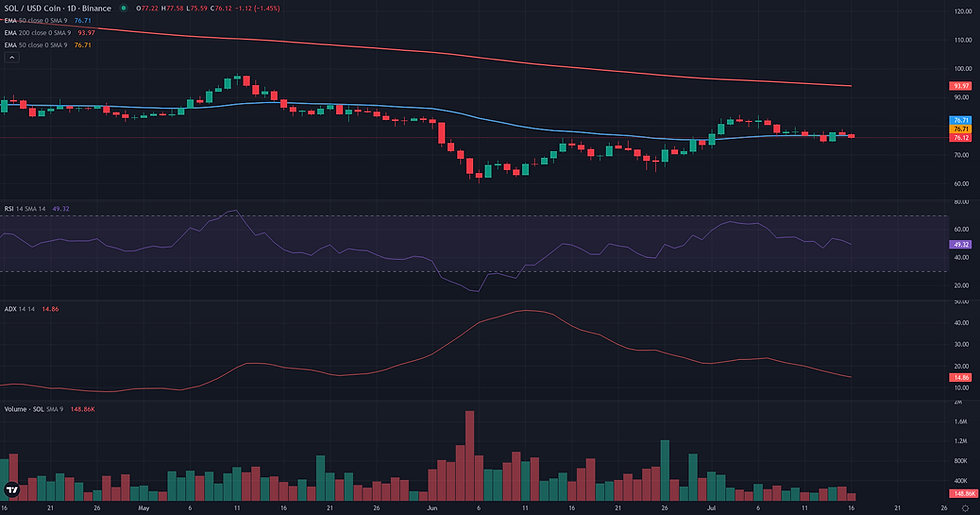
This Solana range rebound analysis examines the current SOL/USDC structure in the context of support defense and weakening alternative frameworks. The SOL/USDC market is currently defined by a clear consolidation phase, with price action contained within a well-established daily range. Trading around the 77 USDC mark, the asset exhibits a distinct lack of directional conviction, a state confirmed by a very low D1 ADX reading of 15.65. This indicates a non-trending environment where neither buyers nor sellers have established control. Momentum is equally neutral, with the D1 RSI hovering near the 52 level, reflecting market indecision. This technical consolidation aligns with recent market analysis indicating a reduction in leveraged exposure and moderated volatility, suggesting a period of internal re-evaluation for Solana rather than a strong directional conviction. The current structure places the asset at a technical crossroads, caught between its daily 50-period moving average and a broader, more bearish weekly context. This sets the stage for analyzing three distinct but competing scenarios: a continuation of range-bound trading, a breakout from the current compression, or a resumption of a prior trend.

Solana Range Rebound Analysis: Support and Friction Zones
Following the identification of a plausible daily range, the resolution of this framework for SOL/USDC hinges on the integrity of the validation zone between 70.26 and 73.22 USDC. This area, anchored by the recent weekly low and key support pivots, represents the structural floor where a rebound could originate. The framework would lose its technical coherence and be invalidated if the price were to achieve a daily close below 70.26. Such a breakdown would signal a failure of the range support and a likely resumption of the broader weekly downtrend. For a rebound to gain traction, it must navigate several layers of resistance. The immediate obstacle is the pivot zone defined by the D1 EMA 50 (76.73) and the D1 Pivot (77.71). A more formidable barrier is the weekly pivot at 78.57. Should these levels be reclaimed, the primary technical projection for a successful rebound would be the upper boundary of the daily range, identified near the D1 Bollinger Band Upper at 84.29. Confirmation of the rebound scenario would involve a clear defense of the validation zone followed by a sustained move above the 77-78 USDC friction area. Conversely, the framework would show signs of weakening if the price continues to drift below local daily supports like 76.42 without any significant buying interest, suggesting that sellers retain control and are preparing to test the range low.


Breakout: Structural Catalyst Assessment
The Breakout framework for SOL/USDC is currently assessed as borderline due to a significant tension between its daily structural preparation and a lack of immediate dynamic confirmation. On the daily chart, the market has formed a technically clean consolidation pattern following its recent peak at 83.91, a level clearly defined by the 20-day Donchian high. This sideways movement is characterized by contracting volume (Volume Oscillator D1 at -32.31) and a very low trend strength reading (ADX D1 at 15.65), which are classic ingredients for a potential breakout scenario. However, two key factors prevent a more confident 'plausible' verdict. First, the immediate momentum is neutral (D1 RSI at 52.15), with price currently hovering around its 50-day EMA rather than coiling tightly beneath the 83.91 resistance. This suggests indecision rather than building pressure. Second, the weekly timeframe presents a significant headwind; the asset remains in a broader downtrend, trading well below its key weekly moving averages. A breakout on the daily chart would therefore be a counter-trend move, facing potentially strong resistance from the higher timeframe structure. The situation is one of structural potential awaiting a dynamic trigger that has not yet materialized.

Continuation: Directional Flow Assessment
The technical case for a bullish continuation on the daily timeframe is currently borderline, defined by a clear tension between price structure and underlying market dynamics. On one hand, the chart displays a constructive sequence: a strong upward impulse from late June to early July was followed by a multi-day consolidation. This pullback has so far respected a key support confluence around 76.11-76.73, formed by the 4H EMA200 and the D1 EMA50, suggesting a potential higher low is in formation. However, this structural potential is severely undermined by a distinct lack of directional energy. The D1 ADX reading of 15.65 points to a non-trending, range-bound environment, which is antithetical to the 'Stable Directional Flow' that a continuation framework seeks. Furthermore, this daily setup exists within a broader weekly context that remains weak, with price trading far below major weekly moving averages. While the structure for a continuation is technically present, the absence of momentum makes the scenario fragile and dependent on a significant shift in market character.
Comparative Framework Verdict
Among the three technical frameworks analyzed, the Range/Rebound scenario presents the most coherent and plausible case for SOL/USDC's current structure. Its core thesis is strongly supported by the market's dynamics, particularly the D1 ADX of 15.65, which clearly signals a non-trending, range-bound environment. This framework identifies a key support zone between 70.26 and 73.22 USDC as the potential floor for a rebound, with the upper boundary of the range situated near 84.29. The primary risk to this view is the underlying bearish pressure from the weekly timeframe. The Breakout and Continuation frameworks are both considered borderline. The Breakout scenario acknowledges the range as a period of energy compression preceding a potential directional move above the 83.91 resistance. However, it is weakened by a lack of immediate bullish momentum and the significant headwind from the bearish weekly trend. The Continuation framework is the weakest of the three. While it correctly identifies a prior bullish impulse, its core requirement for a stable directional trend is directly contradicted by the extremely low ADX reading. The structure for a continuation exists, but the necessary momentum is absent. Moving forward, the key technical markers to watch will be the integrity of the range boundaries. A breakdown below the 70.26 support would invalidate the range thesis and favor a bearish continuation, while a sustained push above 83.91 would be required to validate a bullish breakout.
For broader market context, readers can also review the latest related fundamental analysis for this pair.
For live market monitoring and the full interactive chart, readers can access the dedicated SOL Market Hub.
Disclaimer
CopyTradia provides technical analysis for informational and educational purposes only. This content does not constitute financial advice, investment recommendations, or trading signals. Cryptocurrency markets are highly volatile. Past performance is not indicative of future results. Always conduct your own research (DYOR) and consult a qualified financial advisor before making any investment decisions.


