Solana Price Analysis: Continuation vs. Breakout Scenarios

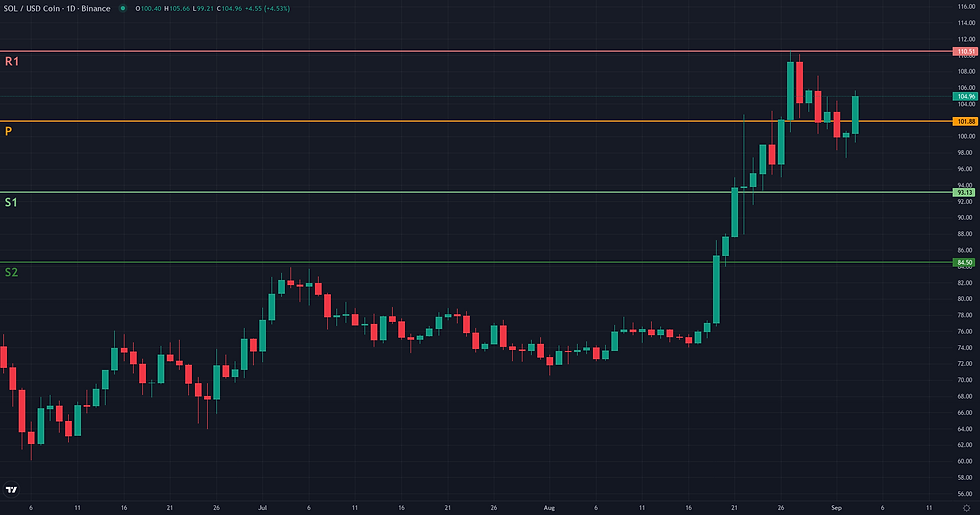
This Solana price analysis examines the current SOL/USDC structure in the context of support defense and weakening alternative frameworks. SOL/USDC is navigating a period of high-level consolidation following a powerful bullish impulse that established a recent high at 110.63. The market's structure is defined by a very strong directional trend, confirmed by a D1 ADX reading of 48.95, while momentum remains firmly in bullish territory with the D1 RSI at 63.55. Despite this underlying strength, the price has pulled back from its peak and is currently trading around the 100.41 level, indicating a pause in the uptrend. This strong technical performance aligns with recent fundamental observations of Solana's autonomous strength against Bitcoin, even as broader market sentiment showed signs of weakening. The current price action represents a critical juncture, caught between the momentum of the recent rally and significant overhead resistance, setting the stage for the competing technical frameworks detailed below.
Solana Price Analysis: Technical Framework Assessment
The Range/Rebound framework is assessed as not technically plausible in the current market context. The framework's core premise—identifying a stabilization or rebound from a support level within an established structure—is fundamentally misaligned with the prevailing market dynamic. The daily chart shows a powerful bullish trend, confirmed by a high ADX reading of 48.95, which signifies a strongly directional environment rather than a range. This uptrend is further validated on the weekly timeframe, where the price has broken out of a multi-month consolidation and is currently trading above its upper Bollinger Band (98.88), a classic sign of bullish expansion. Consequently, the market is in a phase of price discovery and trend continuation, not the 'Controlled Reversal' or consolidation that this framework is designed to capture. For the Range/Rebound framework to become relevant, the current upward momentum would need to fully dissipate and give way to the formation of a clear horizontal trading range, for instance between the recent high near 110.63 and a new support base around the weekly S1 pivot at 93.13.
Breakout: Structural Catalyst Assessment
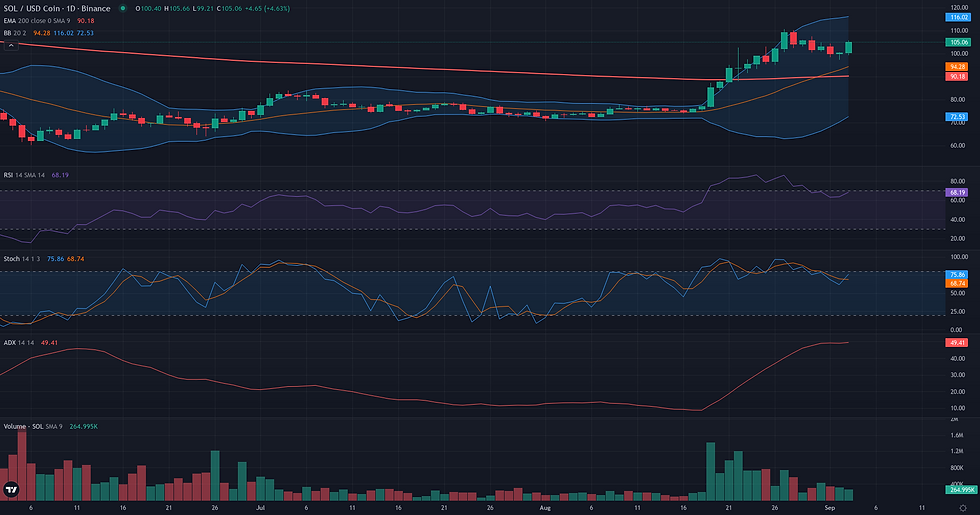
The Breakout framework for SOL/USDC presents a borderline case, characterized by a tension between a powerful underlying trend and a corrective short-term structure. The market recently established a clear and significant resistance at 110.63, the peak of a high-momentum advance. This level, confirmed by the 20-day Donchian channel and the weekly high, serves as the candidate for a structural break. Supporting this potential is the very strong D1 ADX reading of 48.95, which attests to the strength of the preceding trend. Furthermore, the current pullback from the highs is occurring on diminishing volume, as indicated by a Volume Oscillator of -18.43%, a pattern often interpreted as constructive consolidation. However, the primary limiting factor is the price action itself. Instead of coiling tightly beneath the 110.63 resistance, the price has entered a distinct pullback, moving away from the breakout level. This suggests a period of profit-taking or temporary rejection rather than an immediate preparation for a new high. The presence of the W1 EMA 50 at 105.08 adds another layer of potential friction below the key resistance. Consequently, while the foundational elements for a breakout are present, the lack of structural compression makes the scenario premature, warranting a borderline verdict pending further price development.
Continuation: Directional Flow Assessment
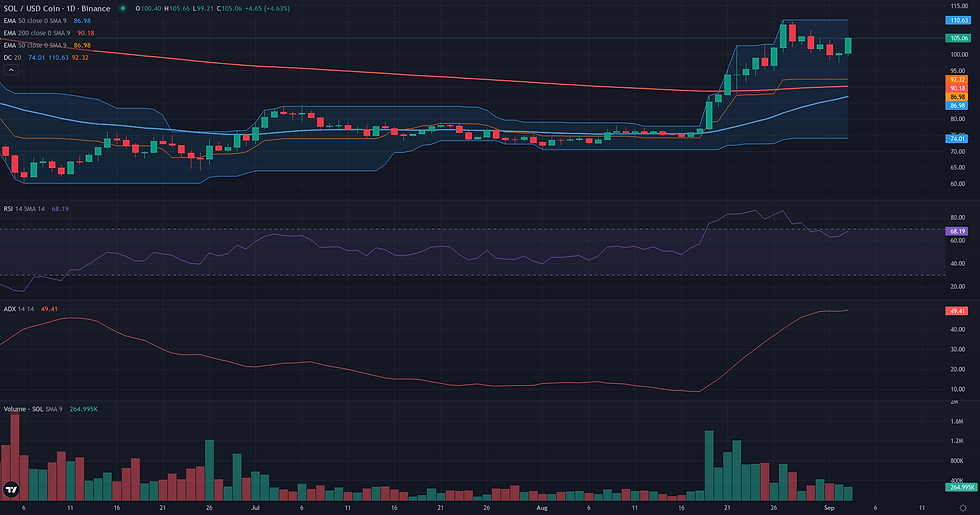
The current market structure for SOL/USDC presents a compelling but contested case for a bullish continuation. The primary supporting element is a powerful daily impulse wave that drove the price from approximately 75.00 to a recent high of 110.63. This move is underpinned by a very strong trend reading, with the D1 ADX at a high value of 48.95. Following this peak, the price has entered a consolidation phase, which appears constructive; the pullback has been shallow and occurred on diminishing volume, as indicated by a D1 Volume Oscillator of -18.43. This suggests a lack of aggressive selling pressure and is often characteristic of a pause before the next directional leg. However, the framework's plausibility is moderated to 'borderline' due to significant structural friction on the weekly timeframe. The price is currently contending with the W1 EMA 50, located at 105.08, which represents a major historical resistance level. While daily momentum is strong, a 'Stable Directional Flow' is difficult to establish while trading directly below such a key long-term average. Furthermore, the D1 EMA 50 remains below the D1 EMA 200, a lagging indicator that nonetheless highlights the nascent, rather than fully established, nature of this new bullish structure. The recent strength observed on the H1 chart suggests buyers are defending the 100.00 level, but a decisive break above the 105.08 weekly resistance is required to resolve the current tension in favor of the bulls.
Comparative Framework Verdict
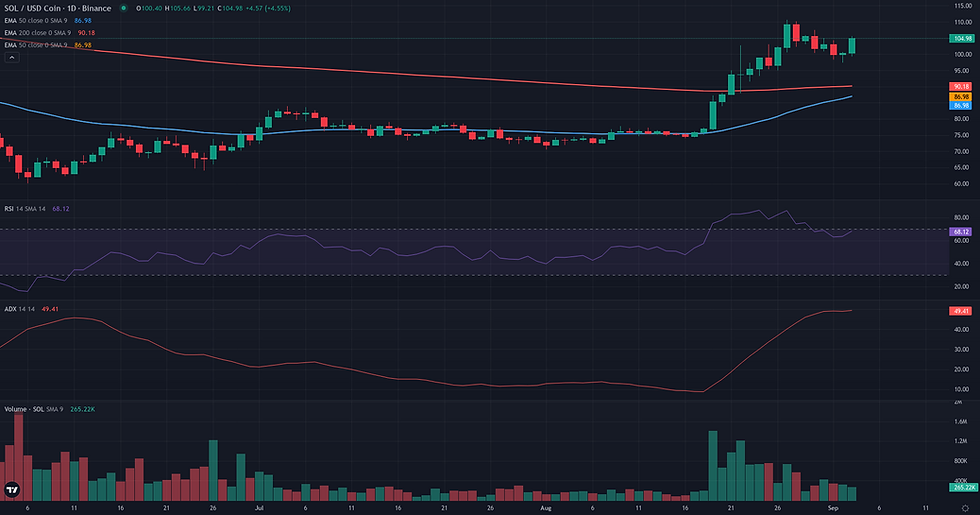
In the current market structure for SOL/USDC, no single technical framework emerges as dominant. Instead, the analysis reveals two competing scenarios, both rated 'borderline', which hinge on how the current consolidation resolves, while a third is clearly invalidated. The Continuation framework is considered borderline, supported by the powerful daily trend (ADX 48.95) and a constructive pullback on low volume. However, its immediate challenge is the significant weekly resistance posed by the W1 EMA 50 at 105.08, which currently caps the advance. Similarly, the Breakout framework is also borderline. It draws strength from the same underlying momentum but focuses on a more definitive structural break above the recent 110.63 high. Its plausibility is tempered by the fact that the price is currently pulling back from this level rather than compressing tightly beneath it, suggesting the setup is premature. Conversely, the Range/Rebound framework is assessed as not plausible. The market's high-momentum, trending environment is fundamentally at odds with the conditions required for range-bound trading or a support-level rebound. The key question for the coming sessions is whether the current pause is a period of re-accumulation ahead of an attempt to clear overhead resistance, or the beginning of a more significant correction.
For broader market context, readers can also review the latest related fundamental analysis for this pair.
For live market monitoring and the full interactive chart, readers can access the dedicated SOL Market Hub.
Disclaimer
CopyTradia provides technical analysis for informational and educational purposes only. This content does not constitute financial advice, investment recommendations, or trading signals. Cryptocurrency markets are highly volatile. Past performance is not indicative of future results. Always conduct your own research (DYOR) and consult a qualified financial advisor before making any investment decisions.


