Solana Bullish Continuation: Overbought Conditions

This Solana bullish continuation examines the current SOL/USDC structure in the context of support defense and weakening alternative frameworks. SOL/USDC has demonstrated formidable bullish strength over the past week, surging from a low of $74.37 to challenge levels above $102. This powerful upward impulse has established a clear directional trend, confirmed by a high D1 ADX reading of 36.76. The price is now trading significantly above key long-term moving averages like the D1 EMA 200, signaling a structural shift in market control. However, this aggressive rally has pushed short-term momentum indicators into extreme territory, with the D1 RSI reaching a deeply overbought level of 82.49, suggesting the current move may be overextended. This technical structure of sustained upward momentum aligns with recent fundamental analysis, which highlighted strong relative performance and increased leveraged interest driving the asset's appreciation. The current technical landscape thus presents a conflict between a confirmed strong trend and signs of potential short-term exhaustion, setting the stage for the strategic frameworks below.
Range & Rebound: Market Structure Assessment
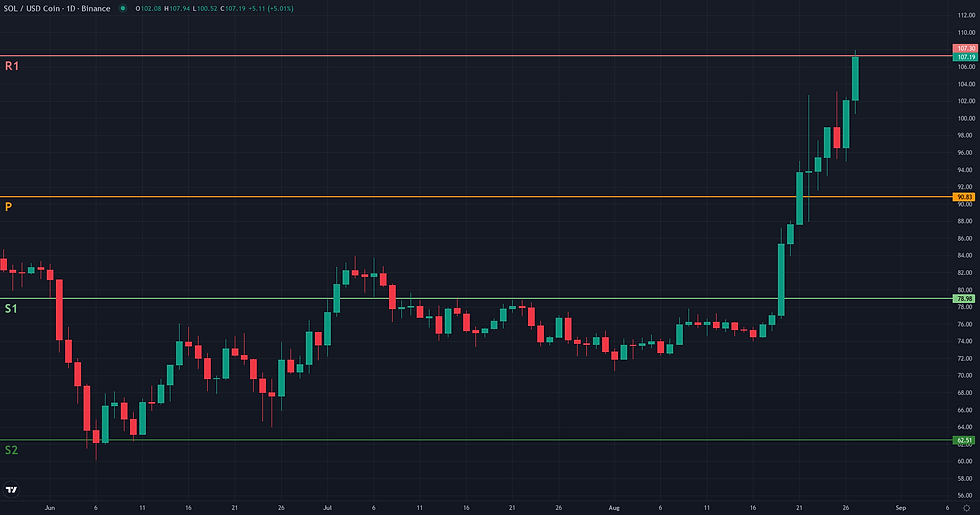
The Range/Rebound framework is currently not plausible for SOL/USDC. The market structure is defined by a powerful bullish breakout, which is fundamentally at odds with the framework's search for stabilization or a rebound from a support zone. Over the past week, the price has surged from the mid-$70s to over $102, decisively breaking out of a multi-month consolidation range. This impulsive move is supported by a strong D1 ADX of 36.76 and has pushed momentum indicators like the D1 RSI to extremely overbought levels (82.49). A Range/Rebound scenario would require evidence of a downtrend losing momentum near a clear support level. Instead, the current context displays accelerating upward momentum and price exploration at new local highs. For this framework to become relevant, the market would first need to undergo a significant correction and then establish a new phase of consolidation or demonstrate clear absorption at a lower structural level.
Breakout: Structural Catalyst Assessment
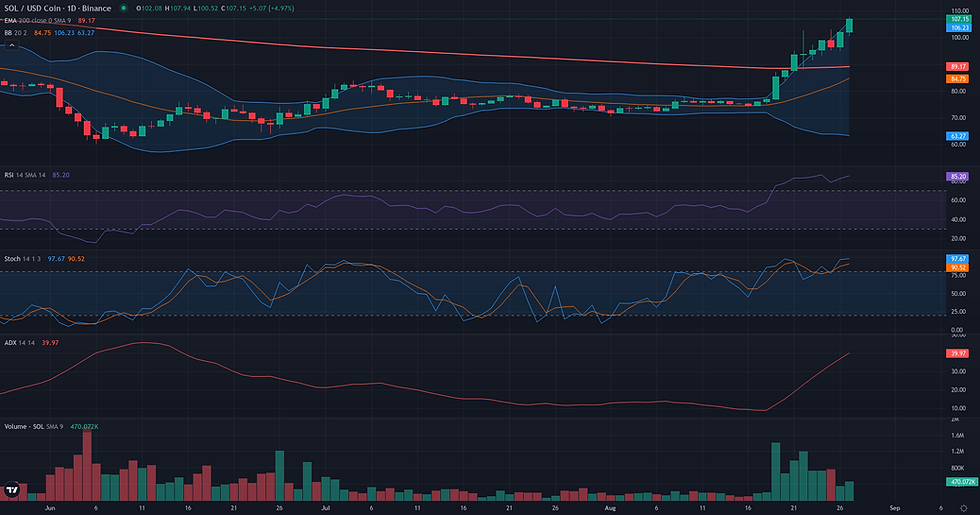
The current market structure for SOL/USDC presents a borderline case for the Breakout framework, characterized by a direct clash between powerful momentum and signs of short-term exhaustion. On one hand, the bullish case is compelling: a violent rally has propelled the price above its 200-day EMA (89.46), with a strong D1 ADX of 36.76 confirming the trend's directional force. The weekly chart reinforces this view with a massive bullish candle and a neutral RSI (54.51), suggesting room for further upside. However, this explosive move directly contradicts the ideal preparation for a sustainable breakout. The price has advanced vertically towards the 103.14 resistance (Donchian 20 D1 upper) without forming any consolidation base, which typically helps absorb selling pressure and build energy. This parabolic structure, combined with a deeply overbought D1 RSI of 82.49, signals a high risk of exhaustion. Furthermore, a successful breakout would immediately face a significant weekly resistance zone between the W1 EMA 50 (105.21) and the W1 R1 pivot (107.30). This tension between the raw power of the trend and the lack of structural preparation makes the breakout scenario technically plausible but highly conditional.

Solana Bullish Continuation: Directional Flow Assessment
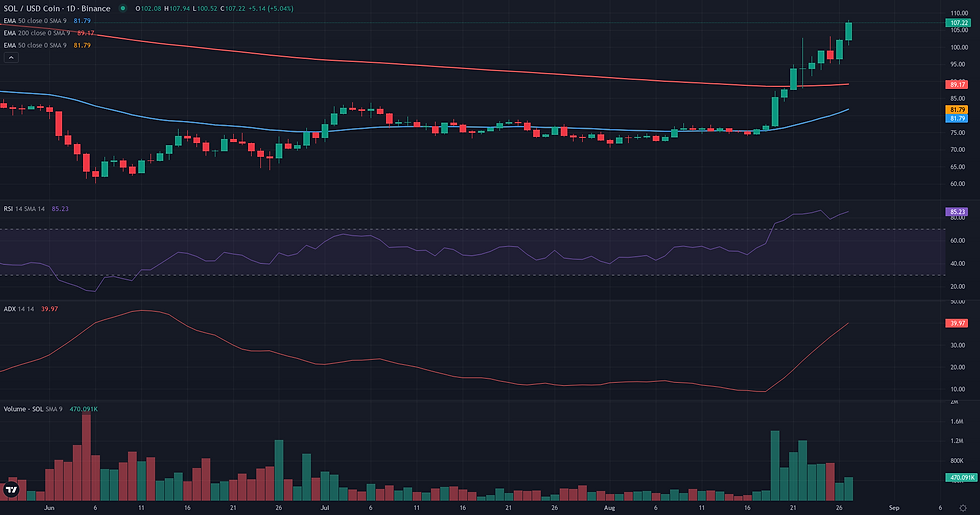
The technical structure for SOL/USDC presents a plausible case for a bullish continuation. The primary driver for this reading is a powerful breakout on the daily chart, which saw the price move decisively above a multi-week consolidation range and, critically, reclaim the D1 EMA 200 at 89.46. This impulse, initiated around August 19th, established a clear directional flow, supported by a strong D1 ADX reading of 36.76 that confirms a trending market environment. This daily structure is reinforced by the weekly context. The last closed weekly candle was a large-bodied bullish breakout, suggesting a potential shift in the higher timeframe market structure. The price is currently trading well above the weekly pivot at 90.83, further cementing bullish control. However, the reading is not without its caveats. The D1 RSI is at an extreme level of 82.49, indicating a deeply overbought condition that could precede a consolidation or pullback. Furthermore, the price is now testing a confluence of potential weekly resistance, including the W1 EMA 50 (105.21) and the W1 R1 pivot (107.30). While the immediate micro-structure on the H1 chart confirms ongoing buying pressure, these higher timeframe resistance levels represent the first significant test for this new bullish trend.
Comparative Framework Verdict
Comparing the three strategic frameworks, the bullish Continuation scenario emerges as the most plausible technical reading for SOL/USDC this week. This framework is well-supported by the decisive breakout from a multi-week consolidation range and the strong directional momentum confirmed by a high D1 ADX. Its validation, based on the price holding above the weekly pivot around $90.83, aligns with the idea of a constructive absorption of the recent gains. The Breakout framework is considered secondary and borderline. While it correctly identifies the powerful underlying trend, it also highlights significant weakening factors, namely the extreme overbought reading on the D1 RSI (82.49) and the parabolic nature of the ascent without a prior consolidation phase. This makes a direct breakout above the $103.14 resistance a high-risk scenario prone to exhaustion. Finally, the Range/Rebound framework is not plausible. The market is in a clear and powerful uptrend, which is the antithesis of the range-bound or bottoming conditions required for this scenario. The key element to watch going forward will be whether the market can build a new consolidation structure to sustain the uptrend or if the overbought conditions will force a corrective pullback toward prior support levels.
For broader market context, readers can also review the latest related fundamental analysis for this pair.
For live market monitoring and the full interactive chart, readers can access the dedicated SOL Market Hub.
Disclaimer
CopyTradia provides technical analysis for informational and educational purposes only. This content does not constitute financial advice, investment recommendations, or trading signals. Cryptocurrency markets are highly volatile. Past performance is not indicative of future results. Always conduct your own research (DYOR) and consult a qualified financial advisor before making any investment decisions.


