Solana Breakout Analysis: SOL Consolidates Below $125

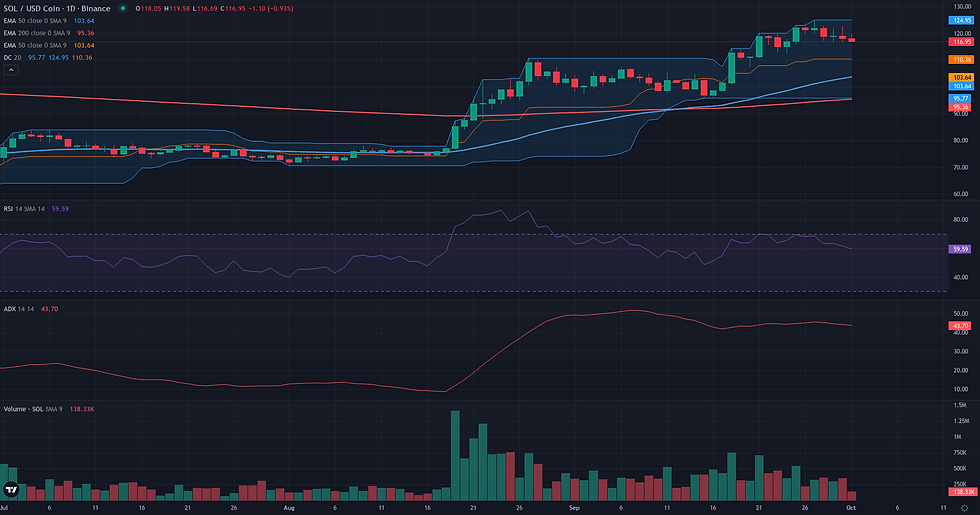
This Solana breakout analysis examines the current SOL/USDC structure in the context of support defense and weakening alternative frameworks. SOL/USDC is currently defined by a powerful and established uptrend, with price consolidating in a tight range following a significant upward impulse. The daily chart shows price holding firm above the $118 mark, supported by strong underlying momentum and trend indicators. The daily ADX reading of 43.33 confirms a very strong directional environment, while the RSI at 61.95 indicates solid bullish control without being immediately overbought. Price remains well above key long-term averages like the D1 EMA 50 ($102.74) and W1 EMA 50 ($106.02), underscoring the structural health of the current bullish phase. This technical picture of a powerful trend pausing to consolidate aligns with recent fundamental observations of Solana's significant relative strength and a period of elevated realized volatility. The market is now coiled below the recent weekly high of $124.95, a critical level that will likely determine the next directional move.

Range & Rebound: Market Structure Assessment
The Range/Rebound framework is not technically plausible for SOL/USDC in the current market structure. The framework is designed to identify stabilization and potential reversals from a support level within a range, but the prevailing market conditions are strongly directional and bullish. The daily chart exhibits a clear uptrend, a fact quantified by a high D1 ADX reading of 43.33, which signals a powerful, trending environment rather than the required slowdown. Price is currently positioned well above its D1 middle Bollinger Band (111.40) and significantly above the D1 EMA 200 (93.13), placing it in a zone of bullish continuation, not at a potential rebound point. This reading is strongly confirmed by the weekly context, where price has recently broken out above its upper W1 Bollinger Band (115.03), a classic sign of trend acceleration. For the Range/Rebound framework to become relevant, the market would first need to demonstrate a structural shift, including a breakdown of the current bullish momentum, a sustained decrease in the D1 ADX below 25, and the subsequent formation of a clear consolidation range.

Solana Breakout Analysis: Structural Catalyst Assessment
The Breakout framework appears technically plausible for SOL/USDC, centered on a well-defined structural resistance at 124.95. Following a powerful upward impulse in mid-to-late September, the price has entered a multi-day consolidation phase directly beneath this peak. This price action is characteristic of a pre-breakout structure, where energy accumulates before a potential continuation. The underlying market dynamics strongly support this reading: the daily ADX at 43.33 indicates a powerful existing trend, while the RSI at 61.95 shows solid bullish momentum with room to expand before reaching overbought territory. Furthermore, the Volume Oscillator's negative value of -11.84 suggests that volume has receded during this sideways movement, a classic sign that selling pressure is low and the market is pausing rather than reversing. While the weekly context is also supportive, a key limiting factor is the approach of the weekly 200-period EMA at 130.43, a major long-term level that could introduce significant friction. However, this does not invalidate the immediate breakout structure itself, which remains coherent and well-supported by the available data.
Continuation: Directional Flow Assessment
The technical structure for SOL/USDC presents a plausible case for a bullish continuation. The primary directional flow is clearly established on the daily timeframe, evidenced by a sequence of higher highs and higher lows since mid-September. This trend is not only visually apparent but is quantitatively confirmed by a strong ADX reading of 43.33, indicating a powerful, trending market. Price is comfortably positioned above key structural supports, including the D1 EMA50 at 102.74 and the W1 EMA50 at 106.02, reinforcing the underlying strength. Momentum, measured by the D1 RSI at 61.95, remains in bullish territory without being overextended, suggesting further upside potential. The recent pullback from the 124.95 peak has been orderly and appears to be a consolidation phase rather than a reversal, a reading supported by a negative Volume Oscillator (-11.84) which suggests the correction is occurring on lighter volume. The only minor point of caution comes from the H1 timeframe, where price action has entered a tight range, indicating a short-term pause. However, this does not detract from the coherent and stable directional structure visible on the higher timeframes, which remains the dominant factor for this analysis.

Comparative Framework Verdict
Comparing the three technical frameworks, a clear consensus emerges favoring bullish scenarios, while the conditions for a range-bound structure are absent. Both the Breakout and Continuation frameworks are deemed plausible, effectively describing the same market reality from two complementary perspectives. The Breakout framework is the most dominant due to its precision. It identifies a clear consolidation pattern just below the well-defined horizontal resistance at $124.95. This setup is supported by a strong underlying trend (ADX at 43.33) and constructive volume patterns, making it a highly coherent hypothesis. The Continuation framework is a strong secondary reading. It focuses on the broader context of the established uptrend, noting that the price is holding firmly above key dynamic supports like the D1 EMA50. This framework sees the current sideways price action as a healthy pause before the next leg up, a view supported by robust momentum indicators. In stark contrast, the Range/Rebound framework is not plausible. The market's high ADX reading and expansive price action are antithetical to the compressive, non-trending environment required for a range to form. Consequently, the analysis points towards monitoring the $124.95 resistance as the key pivot for validating the prevailing bullish structure.
For broader market context, readers can also review the latest related fundamental analysis for this pair.
For live market monitoring and the full interactive chart, readers can access the dedicated SOL Market Hub.
Disclaimer
CopyTradia provides technical analysis for informational and educational purposes only. This content does not constitute financial advice, investment recommendations, or trading signals. Cryptocurrency markets are highly volatile. Past performance is not indicative of future results. Always conduct your own research (DYOR) and consult a qualified financial advisor before making any investment decisions.


