Solana Breakout Analysis: SOL Compresses Below $120 Resistance

This Solana breakout analysis examines the current SOL/USDC structure in the context of support defense and weakening alternative frameworks. SOL/USDC is currently defined by a powerful and mature uptrend, with price consolidating near recent highs after a significant upward push. The daily chart showcases strong directional momentum, confirmed by a very high ADX reading of 43.93 and a healthy RSI of 64.21, which indicates bullish strength without being overbought. Price is trading comfortably above all key moving averages on both daily and weekly timeframes, including the 50-day EMA at $97.24 and the 50-week EMA at $105.37, reinforcing the structural integrity of the trend. This strong technical posture aligns with recent market analysis, which highlighted elevated volatility and a significant increase in open interest, suggesting a new phase of directional activity for Solana. The current price action is characterized by a tight consolidation, setting the stage for the competing technical frameworks discussed below.
Range & Rebound: Market Structure Assessment
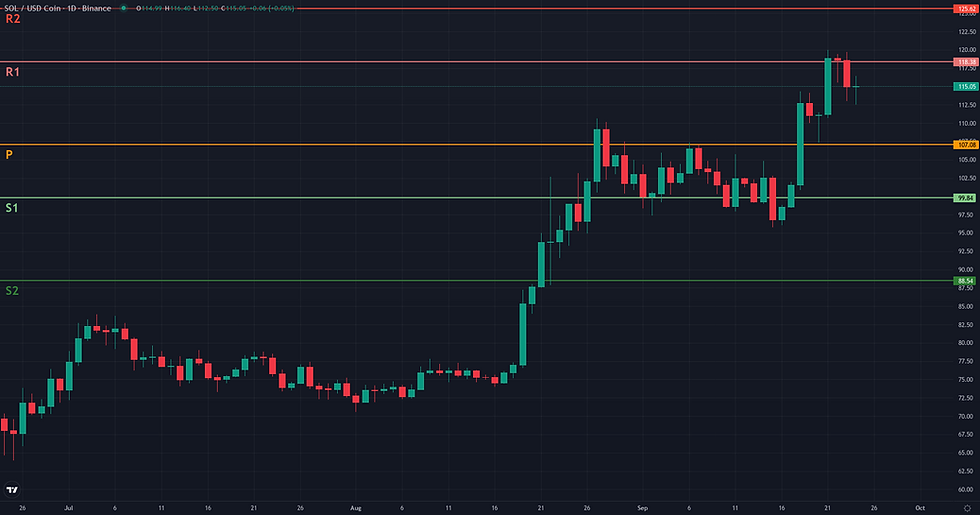
The Range/Rebound framework is currently not plausible for SOL/USDC. The market structure is in direct opposition to the conditions required for this strategy, which seeks stabilization after a decline or a rebound from the lower boundary of a range. Instead, the daily chart displays a powerful uptrend, confirmed by a high D1 ADX reading of 43.93, which signals a strongly directional market. Price is currently trading near the D1 upper Bollinger Band (118.51) and has broken above the W1 upper band (107.90), indicating bullish strength and expansion, not a search for support. The recent breakout above the 100-105 area has shifted the context from consolidation to trend continuation. For the Range/Rebound framework to become relevant, this bullish momentum would need to cease, followed by a significant price correction and the formation of a new, identifiable consolidation structure.
Solana Breakout Analysis: Structural Catalyst Assessment
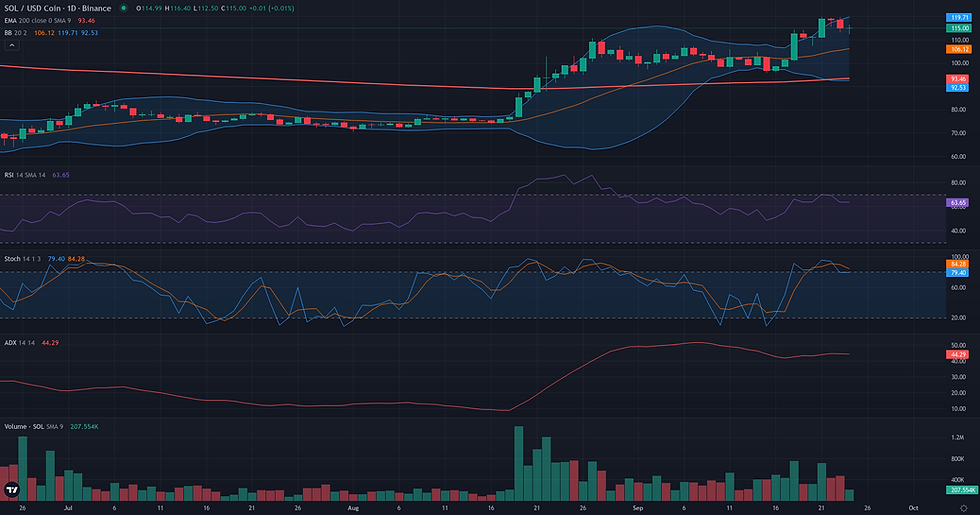
The Breakout framework appears technically plausible for SOL/USDC, based on a clear structural compression forming against a significant resistance ceiling. Over the past three sessions, price has repeatedly tested the zone between the Weekly R1 pivot at 118.38 and the 20-day Donchian high at 119.99 without experiencing a sharp rejection. This behavior suggests potential absorption of selling pressure in preparation for a continuation. The underlying market dynamics strongly support this reading; the ADX on the daily timeframe is at a very high 43.93, signaling a powerful, established trend. Concurrently, the D1 RSI at 64.21 indicates robust bullish momentum that has not yet reached overbought territory. This daily structure is reinforced by the weekly context, where the RSI (62.50) and price action above the 50-week EMA confirm a broader positive bias. The primary element of caution is the price action of the most recent candle, which closed off its highs and below the prior day's low, hinting at emerging resistance. However, this single-candle behavior does not yet negate the compelling multi-day consolidation structure.
Continuation: Directional Flow Assessment
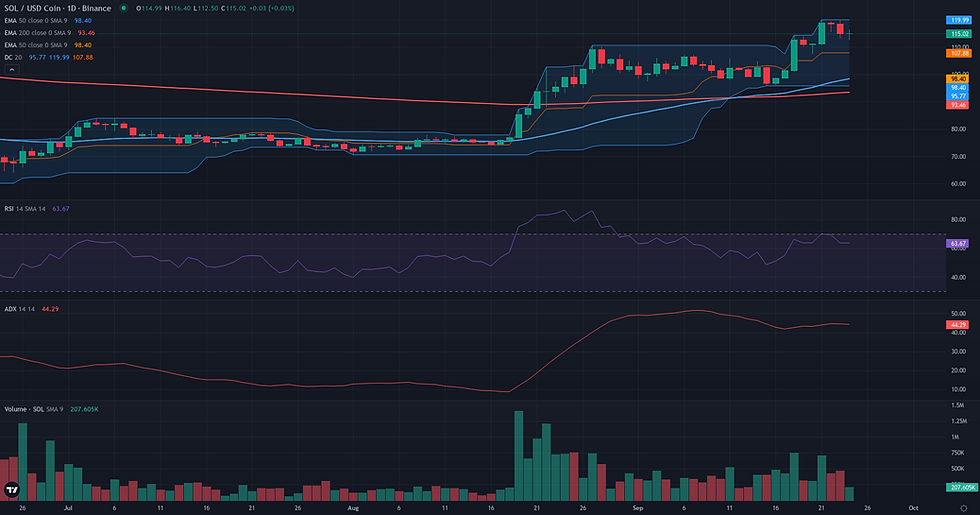
The technical structure for SOL/USDC presents a plausible continuation scenario, anchored in a strong and coherent uptrend on the daily timeframe. The market's directionality is confirmed by a high D1 ADX reading of 43.93, with price maintaining a significant distance above its 50-day EMA (97.24). This daily bullish posture is reinforced by the weekly chart, where price has established a foothold above its 50-week EMA (105.37), signaling a constructive alignment across timeframes. The primary point of analysis is the current pullback from the recent high near 120.00. While the last daily candle was bearish and the H1 chart shows clear short-term selling pressure, the retracement has so far remained shallow, finding initial support around the 113.00-114.00 area, which corresponds to prior breakout levels. This behavior is currently consistent with a healthy consolidation within a dominant uptrend rather than a structural reversal. The continuation framework is therefore retained, contingent on this support zone holding and preventing a deeper correction.
Comparative Framework Verdict
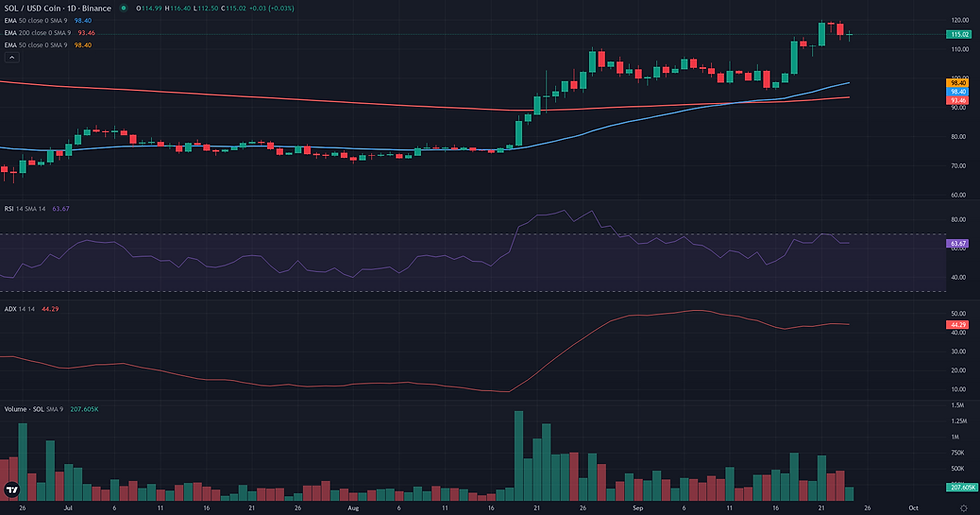
In this week's SOL technical analysis, two of the three frameworks are deemed plausible, both pointing towards a continuation of the bullish structure, while one is clearly invalidated. The Range/Rebound scenario is not plausible due to the market's strong directional trend, which is the antithesis of the required range-bound conditions. The most dominant framework is the Breakout. It captures the immediate market tension, with price compressing tightly below the critical resistance zone between $118.38 and $119.99. Given the extremely high trend strength indicated by the daily ADX, this setup suggests the market is building energy for a potential decisive move to the upside. The Continuation framework is a very strong secondary and is complementary to the breakout thesis. It focuses on the current pullback as a healthy consolidation, defining a key support zone between $112.99 and $114.31. The validity of the breakout scenario is contingent on this support holding. Essentially, the Continuation framework describes the condition, while the Breakout framework describes the potential outcome. The key development to monitor is whether buyers can defend the pullback support and ultimately force a sustained break above the $120 resistance.
For broader market context, readers can also review the latest related fundamental analysis for this pair.
For live market monitoring and the full interactive chart, readers can access the dedicated SOL Market Hub.
Disclaimer
CopyTradia provides technical analysis for informational and educational purposes only. This content does not constitute financial advice, investment recommendations, or trading signals. Cryptocurrency markets are highly volatile. Past performance is not indicative of future results. Always conduct your own research (DYOR) and consult a qualified financial advisor before making any investment decisions.


