Solana Breakout Analysis: Strong Trend Below Resistance

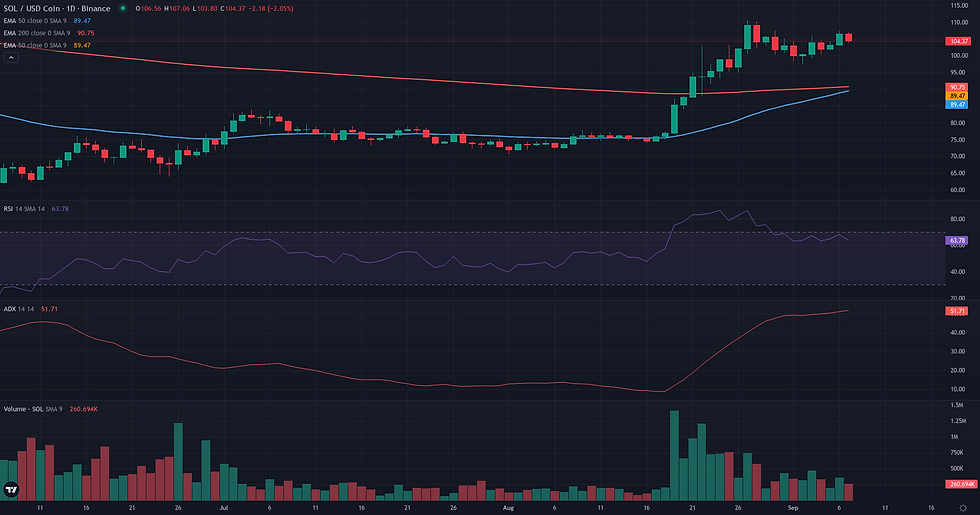
This Solana breakout analysis examines the current SOL/USDC structure in the context of support defense and weakening alternative frameworks. SOL/USDC is currently defined by a powerful and sustained uptrend, with the price consolidating after a significant upward impulse. The daily ADX reading of 51.04 confirms an exceptionally strong directional market, while the daily RSI at 68.10 indicates robust bullish momentum that has yet to reach extreme overbought levels. Price action remains firmly above key moving averages, including the 50-week EMA at $105.13, reinforcing the strength of the underlying trend on a higher timeframe. The current market structure is one of a pause or consolidation, with price trading in a tighter range below the recent swing high. This technical pause aligns with the recent fundamental context, where the market appears to be re-evaluating its significant recent gains amidst a period of elevated volatility. The key question for the week ahead is whether this consolidation is a precursor to another upward move or the beginning of a more significant correction.

Range & Rebound: Market Structure Assessment
The Range/Rebound framework is assessed as not plausible in the current market context. The primary reason for this conclusion is the overwhelmingly directional and trending nature of the price action, which stands in direct contradiction to the stabilization and range-bound conditions this framework is designed to identify. The daily ADX, at a very high reading of 51.04, signals a powerful and sustained trend, leaving little room for a range interpretation. This is further corroborated by a strong daily RSI of 68.10, indicating robust bullish momentum rather than the exhaustion typically preceding a rebound from a support zone. On the weekly timeframe, the context reinforces this trend-driven assessment. Price has decisively broken above the upper weekly Bollinger Band at 103.22, a technical event that often signals trend acceleration, not consolidation. While price has experienced a minor pullback from the recent high of 110.63 to a low of 97.34, this behavior is more characteristic of a brief pause or bull flag within an ongoing uptrend than the formation of a stable range. For the Range/Rebound framework to become relevant, the market would first need to show signs of trend exhaustion, followed by the development of a clear horizontal price structure over a more significant period, allowing for the identification of reliable support and resistance levels.

Solana Breakout Analysis: Structural Catalyst Assessment
The Breakout framework appears technically plausible for SOL/USDC due to a constructive alignment between daily price structure and weekly context. The daily chart reveals a powerful underlying trend, evidenced by a high ADX reading of 51.04. Following a strong impulse move that peaked at 110.63, the price has entered a consolidation phase, trading in a relatively tight range just below this key resistance. This price behavior is characteristic of a market preparing for a potential continuation. The significance of the 110.63 level is reinforced by its proximity to the weekly R1 pivot at 110.16, creating a clear and confluent resistance zone. The weekly chart provides a supportive backdrop, showing a strengthening uptrend and a price that has recently reclaimed its 50-week moving average. While the strong momentum (D1 RSI at 68.10) supports the potential for an upward resolution, a minor point of caution is the recent decline in volume, with the Volume Oscillator at -20.00. A decisive breakout would ideally be accompanied by a significant expansion in volume to confirm conviction.

Continuation: Directional Flow Assessment
The technical structure for SOL/USDC presents a plausible case for a bullish continuation. The market has established a powerful directional flow, evidenced by a very high D1 ADX reading of 51.04, which indicates a strongly trending environment. Following a significant impulse move that peaked at 110.63, the price has undergone a period of consolidation. This consolidation has been constructive, with price action finding support and remaining above the weekly pivot point at 103.75. The most recent daily candle shows renewed buying interest, closing strongly near the recent highs. This D1 structure is reinforced by the weekly context, where the price has reclaimed the W1 EMA 50 at 105.13 and the W1 RSI at 60.29 suggests sustained upward momentum. While a decrease in volume during the consolidation (Volume Oscillator D1: -20.00) warrants attention, the overall balance of forces, from trend strength to multi-timeframe alignment, supports the reading of a market pausing before a potential next leg higher.
Comparative Framework Verdict
Comparing the three technical frameworks, a clear consensus emerges in favor of a trend-following perspective. Both the Breakout and Continuation frameworks are assessed as plausible, while the Range/Rebound scenario is deemed not plausible. The rejection of the range-bound thesis is unequivocal, driven by a very high daily ADX of 51.04 that signals a powerful, trending market, which is the antithesis of the conditions required for a range to form. The two plausible frameworks, Breakout and Continuation, both interpret the current price action as a constructive pause within a larger uptrend. They differ primarily in their focus. The Continuation framework identifies the immediate daily high around $107.36 as the key level to overcome for the trend to resume. The Breakout framework takes a slightly broader, more structural view, focusing on the major swing high at $110.63 as the critical resistance. Because the $110.63 level represents the peak of the entire recent impulse and is reinforced by other calculated resistances, the Breakout framework offers a slightly more dominant and comprehensive view of the market's primary challenge. Consequently, monitoring how price behaves around this upper boundary will be critical to assessing whether bulls can maintain control and drive the next leg of the trend.
For broader market context, readers can also review the latest related fundamental analysis for this pair.
For live market monitoring and the full interactive chart, readers can access the dedicated SOL Market Hub.
Disclaimer
CopyTradia provides technical analysis for informational and educational purposes only. This content does not constitute financial advice, investment recommendations, or trading signals. Cryptocurrency markets are highly volatile. Past performance is not indicative of future results. Always conduct your own research (DYOR) and consult a qualified financial advisor before making any investment decisions.


