SOL/USDC Price Breakout Analysis: Trend Remains Weak

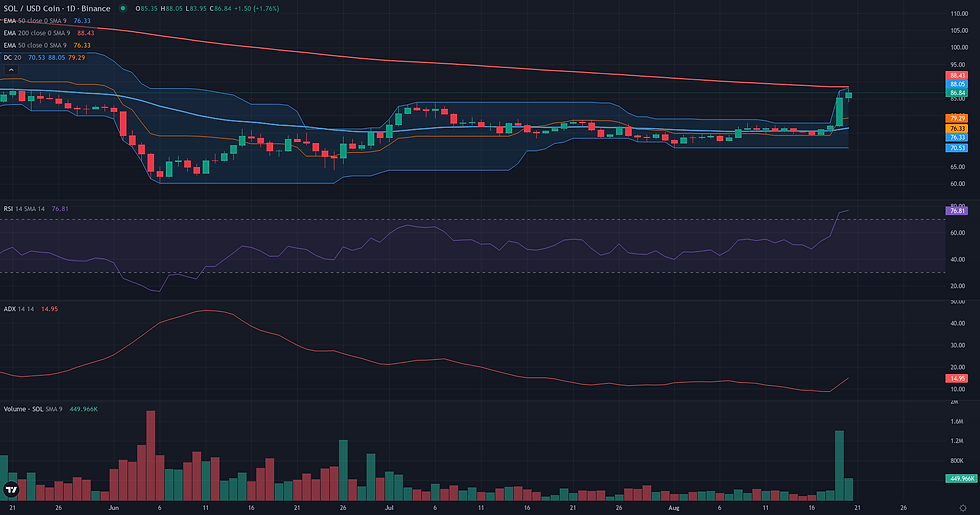
This SOL/USDC price breakout analysis examines the current SOL/USDC structure in the context of support defense and weakening alternative frameworks. SOL/USDC has undergone a significant shift in market character, breaking decisively from a multi-week consolidation phase with a powerful upward impulse. The daily close at 85.34 on August 19th represents a clear structural break, driven by a surge in volume and confirmed by strong short-term momentum, with the D1 RSI reaching an elevated 74.95. However, this explosive move originates from a non-trending base, as indicated by a very low D1 ADX of 11.91. This powerful move marks a decisive end to the period of consolidation and reduced volatility noted in our recent fundamental analysis, replacing the market's sideways drift with a clear directional impulse. The current technical picture is therefore one of a powerful but isolated bullish event challenging a weak underlying trend structure, with the price now approaching the D1 EMA200 at 89.42, a key long-term reference level.

Range & Rebound: Market Structure Assessment
The Range/Rebound framework is assessed as not plausible for SOL/USDC at this time. The market structure has undergone a significant character shift, moving from a multi-week consolidation phase to a high-momentum breakout. While the price had been oscillating in a broad range roughly between 70 and 80 USDC, the most recent daily session on August 19th produced an explosive bullish candle closing at 85.34 on exceptionally high volume (Volume Oscillator D1 at 101.91). This impulsive move shattered the upper boundary of the previous range and pushed the D1 RSI to a high of 74.95. This dynamic is the antithesis of the 'Controlled Reversal' signature sought by this framework, which prioritizes gradual stabilization and rebalancing near a support zone. The current price action is not a rebound within a range but a potential breakout from it. For the Range/Rebound framework to become relevant, the market would need to invalidate this breakout by returning inside the prior range and demonstrate signs of stabilization rather than directional momentum.

SOL/USDC Price Breakout Analysis: Structural Catalyst Assessment
The Breakout framework appears plausible for SOL/USDC, centered on a powerful structural event observed on the daily chart. After a month of consolidation within a range roughly defined between 72.00 and 78.83, the price has executed a decisive upward break. The candle of August 19th is the focal point of this analysis, closing at 85.34 after reaching a high of 87.22. This move is not an isolated price spike; it is strongly supported by a massive surge in volume, as indicated by the Volume Oscillator D1 reading of 101.91, suggesting significant market participation. Momentum aligns with this view, with the D1 RSI reaching 74.95, confirming the strength of the buying pressure. The preceding compression phase was technically clean, evidenced by a low D1 ADX of 11.91 just before the move, fulfilling the 'energy release' signature of the framework. However, this bullish daily picture faces significant friction from the weekly timeframe. The W1 RSI stands at a weak 39.70, well below the neutral 50 mark, indicating that the longer-term trend does not yet support this breakout. This creates a notable divergence between the explosive daily dynamic and the underlying weekly structure, suggesting that while the breakout itself is technically valid, its path forward may encounter substantial resistance inherited from the broader market context.
Continuation: Directional Flow Assessment
The technical structure for SOL/USDC presents a borderline case for a bullish continuation. The primary supporting factor is the explosive breakout candle on August 19th, which saw the price surge from 77.02 to a close of 85.34 on exceptionally high volume (Volume Oscillator 101.91). This move decisively cleared a month-long consolidation range and the D1 EMA50 at 75.90, injecting significant bullish momentum as confirmed by a D1 RSI of 74.95. However, this powerful impulse is not yet a stable trend. The main limiting factor is the D1 ADX, which sits at a very low 11.91, indicating the market was in a non-trending state prior to the breakout. This contradicts the 'Stable Directional Flow' signature central to the Continuation framework. Furthermore, the weekly context provides headwinds, with the price remaining well below the W1 EMA50 (105.61) in a broader bearish-to-neutral structure. The current situation is therefore one of a powerful but isolated impulse against a non-trending and weakly structured backdrop, making the plausibility of a smooth continuation uncertain.

Comparative Framework Verdict
Comparing the three technical frameworks, the Breakout scenario emerges as the most plausible interpretation of the current market structure for SOL/USDC. Its core thesis is validated by a textbook structural break above the prior range high of approximately 78.83, supported by a massive volume spike and strong D1 momentum. This framework best captures the impulsive and decisive nature of the recent price action. In a secondary position, the Continuation framework is rated as borderline. While it correctly identifies the strength of the bullish impulse candle, it is significantly weakened by the lack of an established trend. The D1 ADX reading of 11.91 signals a non-trending environment, which is a core contradiction for a continuation scenario that relies on a stable directional flow. Furthermore, the weak weekly context acts as a headwind against a smooth follow-through. The Range/Rebound framework is assessed as not plausible. The market's explosive move out of its previous range directly invalidates the premise of a controlled reversal or stabilization near a support level. The current dynamic is one of expansion and momentum, the antithesis of a range-bound environment. Looking ahead, the key element to monitor will be whether this breakout can transition into a sustainable trend, which would require the ADX to rise and for price to establish support above the broken resistance.
For broader market context, readers can also review the latest related fundamental analysis for this pair.
For live market monitoring and the full interactive chart, readers can access the dedicated SOL Market Hub.
Disclaimer
CopyTradia provides technical analysis for informational and educational purposes only. This content does not constitute financial advice, investment recommendations, or trading signals. Cryptocurrency markets are highly volatile. Past performance is not indicative of future results. Always conduct your own research (DYOR) and consult a qualified financial advisor before making any investment decisions.


