SOL Continuation Technical Analysis: Breakout & Overbought Momentum

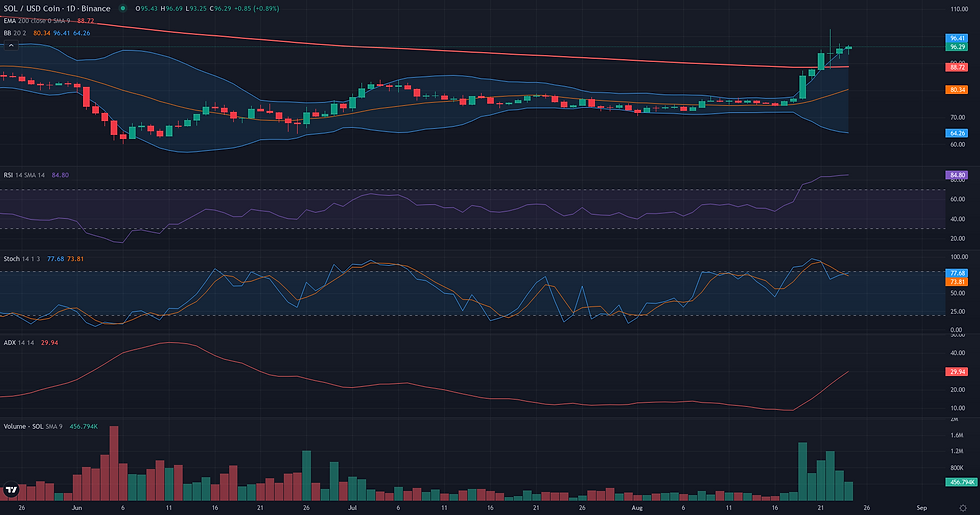
This SOL continuation technical analysis examines the current SOL/USDC structure in the context of support defense and weakening alternative frameworks. SOL/USDC has demonstrated significant strength over the past week, executing a powerful breakout from a multi-week consolidation range to trade near $95.44. This impulsive move has reshaped the technical landscape, pushing the price decisively above key long-term moving averages like the D1 EMA 200. The current market structure is defined by a tension between this established bullish momentum and signs of short-term exhaustion. The daily Relative Strength Index (RSI) is at an extremely overbought level of 84.22, while the ADX at 26.46 confirms the trend is strengthening. This technical breakout aligns with fundamental observations of sustained market strength and increased leveraged interest, suggesting a significant shift in speculative engagement. The key question for the week ahead is whether the market will consolidate its gains to reset momentum or continue its upward trajectory despite the overextended conditions.

Range & Rebound: Market Structure Assessment
The Range/Rebound framework is currently not plausible for SOL/USDC. The market structure is defined by a powerful bullish breakout, which is fundamentally misaligned with the framework's objective of identifying a controlled rebound from a support zone. The recent price action, particularly the explosive move from ~75 to a high of 102.69, demonstrates an impulsive trend, not a stabilization phase. This breakout is technically confirmed by multiple convergent indicators: the D1 RSI is at an extreme overbought level of 84.22, the D1 ADX has risen to 26.46, signaling a strengthening trend, and the Volume Oscillator at 70.93 indicates that the move is supported by significant volume. The weekly chart reinforces this reading with a large bullish engulfing candle that has broken out of a multi-month consolidation area. For the Range/Rebound framework to become relevant, the market would first need to establish a clear downtrend or a corrective phase, followed by signs of momentum exhaustion and price stabilization at a well-defined support level. The current dynamic is one of trend continuation, not reversal from a low.
Breakout: Structural Catalyst Assessment
The Breakout framework presents a borderline case for SOL/USDC. The primary supporting element is the recent explosive price expansion, where the asset broke out of a multi-week consolidation range around $75, reaching a high of $102.69. This impulse was validated by a significant surge in volume (Volume Oscillator D1 at 70.93) and a strengthening trend indicated by the ADX D1 rising to 26.46. However, the framework's plausibility is tempered by two critical factors. First, the ideal market structure of a compression phase directly preceding a breakout is absent; instead, the price is currently consolidating after the initial powerful move. Second, and more importantly, the daily momentum is severely overextended, with the RSI D1 at a deeply overbought reading of 84.22. This suggests a high risk of short-term exhaustion, which could lead to a more profound pullback or sideways chop rather than an immediate continuation. While the weekly context is constructive following a powerful bullish candle, the price is also approaching potential resistance near the W1 EMA50 at $105.21. This tension between the demonstrated raw power of the recent move and the clear signs of short-term exhaustion makes the breakout scenario borderline, contingent on a break of the recent $102.69 high.

SOL Continuation Technical Analysis: Directional Flow Assessment
The technical structure for SOL/USDC presents a plausible case for a bullish continuation. The primary driver for this reading is a recent and decisive breakout from a multi-week consolidation range. This move, initiated on August 19th, was accompanied by a significant surge in volume, as evidenced by the D1 Volume Oscillator reaching 70.93, suggesting strong conviction behind the breakout. Structurally, the price has cleared a critical long-term hurdle by crossing above the D1 EMA 200 (currently at 89.55), a level that now serves as a key potential support for the newly established uptrend. This daily timeframe bullishness is reinforced by the weekly context, where the price action has printed a large, impulsive candle, signaling a potential macro shift after a prolonged basing period. With the W1 RSI at a non-overbought 54.51, there appears to be room for further upside on a larger scale. However, a key point of caution is the D1 momentum, with the RSI at an extremely overbought level of 84.22. While the D1 ADX at 26.46 confirms the trend's strength, the stretched RSI indicates a heightened risk of a pullback or consolidation. The H1 micro-structure currently shows a constructive digestion of recent gains rather than a sharp reversal, which tempers the immediate risk of exhaustion. The continuation thesis therefore hinges on the market absorbing this overbought condition while maintaining its position above the key breakout zone around the D1 EMA 200.

Comparative Framework Verdict
Comparing the three technical frameworks, the Bullish Continuation scenario emerges as the most plausible interpretation of the current market structure for SOL/USDC. This framework is anchored in the recent high-volume breakout that pushed the price above the critical D1 EMA 200, currently around $89.55. It frames the current price action as a consolidation phase within a newly established uptrend, a view supported by a strong weekly candle and a weekly RSI that is not yet overbought. The Breakout framework presents a secondary, borderline case. While it correctly identifies the raw power of the recent impulse, its plausibility is tempered by the market's current state. The price is in a post-breakout digestion phase rather than an ideal pre-breakout compression, and the daily RSI is severely overextended, signaling a high risk of short-term exhaustion. This makes an immediate push above the recent high of $102.69 less probable without a period of consolidation. Finally, the Range/Rebound framework is deemed not plausible. The market's clear directional momentum and structural breakout are fundamentally at odds with the conditions required for a rebound from a support level within a defined range. Looking ahead, the key technical dynamic will be how the market resolves the conflict between the strong underlying trend and the overbought daily indicators. A successful defense of the support zone around the D1 EMA 200 would lend significant weight to the continuation thesis.
For broader market context, readers can also review the latest related fundamental analysis for this pair.
For live market monitoring and the full interactive chart, readers can access the dedicated SOL Market Hub.
Disclaimer
CopyTradia provides technical analysis for informational and educational purposes only. This content does not constitute financial advice, investment recommendations, or trading signals. Cryptocurrency markets are highly volatile. Past performance is not indicative of future results. Always conduct your own research (DYOR) and consult a qualified financial advisor before making any investment decisions.


