SEI/USDC Bearish Continuation: Support Fails at $0.05

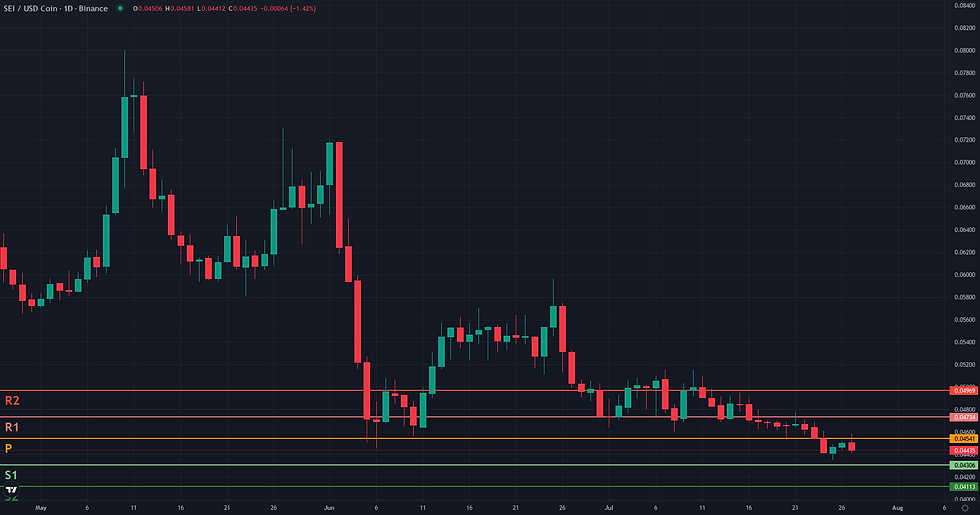
This SEI/USDC bearish continuation examines the current SEI/USDC structure in the context of support defense and weakening alternative frameworks. SEI/USDC has entered a critical phase after breaking down below the key $0.05 support level, a floor that had contained price action for nearly a month. The asset is currently trading near its weekly low at $0.04, reflecting a decisive shift in market structure. This move occurs within a context of weak daily momentum, as shown by an RSI of 36.72, and a non-trending ADX at 17.62, suggesting the bearish follow-through has not yet developed strong conviction. This technical breakdown resolves a period of consolidation that, as noted in the latest fundamental analysis, was characterized by subdued volatility and a lack of directional conviction. With price now trading significantly below its key daily and weekly moving averages, the market's underlying weakness is apparent, setting the stage for evaluating potential trend continuation.
Range & Rebound: Market Structure Assessment
The Range/Rebound framework is currently not plausible for SEI/USDC. The market structure is defined by a recent breakdown below the critical 0.05 support level, which had contained price for nearly a month. This action invalidates the pre-existing range, shifting the context from consolidation to bearish continuation. While the price has found a temporary halt at a confluence of technical supports around 0.04—including the lower Bollinger Bands on both daily and weekly charts, as well as weekly pivot points—these factors are insufficient to justify a rebound framework. The dominant technical reading is the structural break, which is reinforced by a strong weekly downtrend (ADX W1: 35.64). The daily momentum, with an RSI of 36.72, remains weak and lacks any sign of bullish divergence that would signal a potential reversal. For this framework to become relevant, the market would first need to demonstrate a convincing reclaim of the 0.05 level, effectively nullifying the breakdown and re-establishing a potential range structure.

Breakout: Structural Catalyst Assessment
The Breakout framework is currently not plausible for SEI/USDC. The market structure presents a clear contradiction to the required conditions for a bullish structural break. For the past month, the price consolidated in an extremely tight range, using 0.05 as a floor. However, recent price action has resulted in a breakdown below this level, with the last three daily closes at 0.04. This is not a compression phase preparing for an upward thrust through resistance; it is a resolution downwards from a period of equilibrium. This bearish structural reading is reinforced by momentum indicators. The Daily RSI at 36.72 and the ADX at 17.62 signal a lack of both bullish momentum and directional trend. Furthermore, the weekly context is decisively bearish. Price is trading significantly below its major weekly moving averages (EMA 50 W1 at 0.12) and the weekly RSI (33.59) confirms a persistent lack of strength. For a bullish breakout to become a consideration, the market would first need to reclaim the 0.05 level on a sustained basis with a notable expansion in volume, and then build a new consolidation pattern against a higher resistance.

SEI/USDC Bearish Continuation: Directional Flow Assessment
The technical structure for SEI/USDC presents a plausible case for a bearish continuation. The primary catalyst for this reading is the recent daily close below the critical $0.05 support level, a price floor that contained selling pressure for approximately one month. This breakdown is not an isolated event but rather a potential resumption of the dominant weekly downtrend, which exhibits significant strength (ADX W1: 35.64). The price is currently trading well below all key long-term moving averages on both daily (EMA 200 at $0.08) and weekly (EMA 50 at $0.12) charts, reinforcing the overarching bearish context. However, the reading is not without nuance. The daily trend momentum is still weak (ADX D1: 17.62) and the breakdown volume is subdued (Volume Oscillator D1: -41.39), indicating that conviction has not yet fully entered the market. This suggests that while the structural path of least resistance appears to be downwards, the immediate follow-through lacks dynamism. The key test will be how price interacts with the former support at $0.05, which now aligns with the D1 EMA 50 and could serve as a pivotal resistance area.

Comparative Framework Verdict
Comparing the three technical frameworks, the Bearish Continuation scenario emerges as the only plausible structure for SEI/USDC. This reading is anchored in the recent and decisive breakdown below the $0.05 support level, which aligns with the strong, pre-existing weekly downtrend. The validation for this framework hinges on price failing to reclaim this former support, which now acts as a potential resistance confluence. In contrast, both the Range/Rebound and Breakout frameworks are deemed not plausible. The Range/Rebound case is invalidated by the very event that makes continuation viable: the failure of the range floor at $0.05. There is no longer a defined range to trade within. Similarly, a bullish Breakout is structurally contradicted by the market’s bearish resolution from its recent consolidation. The current price action is one of support failure, not compression below resistance. Therefore, the immediate technical focus shifts to observing the market's reaction to the $0.05 level. A rejection from this area would solidify the bearish continuation thesis, while a swift reclaim would challenge the current dominant outlook.
For broader market context, readers can also review the latest related fundamental analysis for this pair.
For live market monitoring and the full interactive chart, readers can access the dedicated SEI Market Hub.
Disclaimer
CopyTradia provides technical analysis for informational and educational purposes only. This content does not constitute financial advice, investment recommendations, or trading signals. Cryptocurrency markets are highly volatile. Past performance is not indicative of future results. Always conduct your own research (DYOR) and consult a qualified financial advisor before making any investment decisions.


