SEI Technical Analysis: Range Breakout Faces Critical Test at $0.06 Resistance

This SEI technical analysis examines the current SEI/USDC structure in the context of support defense and weakening alternative frameworks. SEI/USDC is at a critical juncture after breaking out from a month-long consolidation range between $0.04 and $0.05. The recent price action shows a significant increase in bullish momentum, with the daily RSI pushing to a strong 66.28 and the ADX rising to 26.81, indicating the potential start of a new trend. The market is now directly challenging the overhead resistance cluster around the $0.05 to $0.06 zone, which includes the daily 50-period and 200-period EMAs. This technical shift from consolidation to a potential trend is supported by recent fundamental analysis highlighting a surge in open interest and volatility, indicative of renewed speculative momentum. The current structure presents a classic conflict between this emerging daily strength and the persistent bearish context on the weekly timeframe, making the immediate price action pivotal for determining the market's next directional move.
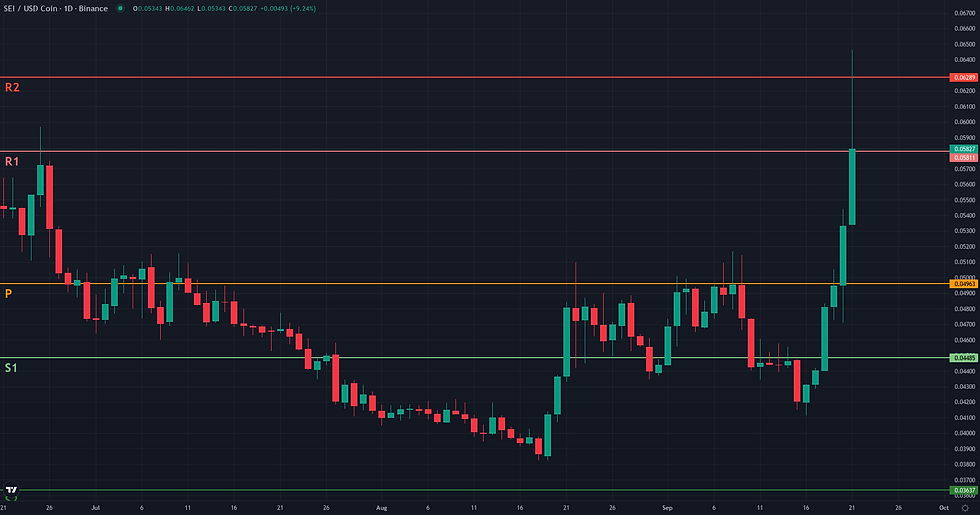
SEI Technical Analysis: Support and Friction Zones
The Range/Rebound framework for SEI/USDC, anchored by the validation zone of price holding above 0.04, has evolved into a more dynamic scenario. The initial rebound from the 0.04 support has not only reached the 0.05 range ceiling but is now attempting to break out of the entire consolidation structure with significant momentum. The resolution of this framework now hinges on the market's interaction with the formidable 0.06 resistance level. The invalidation zone for the underlying bullish structure remains a definitive daily close below the 0.04 support. Such a move would negate the multi-week consolidation and signal a breakdown. Currently, the primary friction is concentrated at the 0.06 price level. This area represents a major technical confluence, including the D1 200-period EMA and both the daily and weekly R1 pivots, making it a critical test for bulls. A failure to overcome this barrier could lead to a pullback, with the former range high at 0.05 now acting as the first line of support. If the breakout momentum is sustained and price establishes a foothold above 0.06, the technical projection points towards the 0.08 area, a previous weekly high and the next logical structural target. Confirmation of this bullish transition would be a daily close above the 0.06 resistance cluster. Conversely, the framework would weaken significantly if price is rejected at 0.06 and subsequently loses the 0.05 support on a 4H basis, suggesting the breakout attempt has failed and the asset is likely to fall back into its previous range.
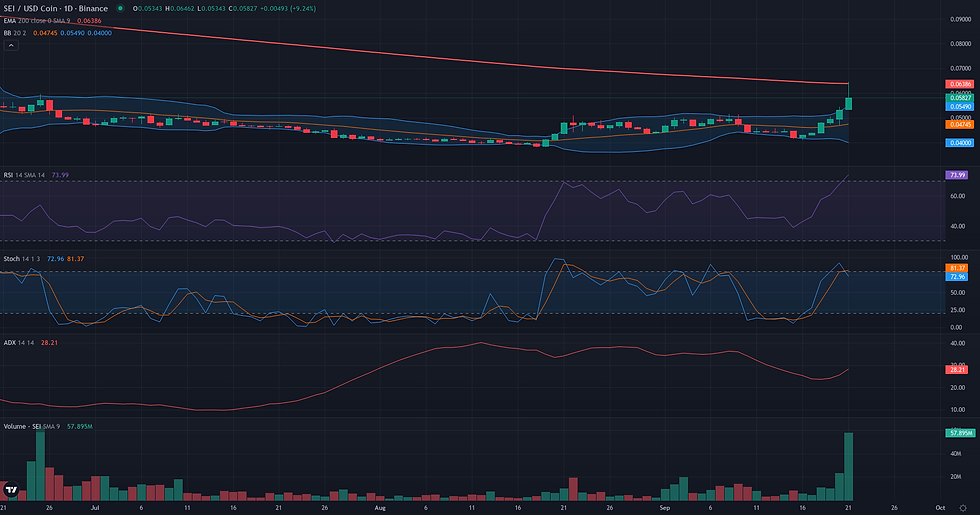

Breakout: Structural Catalyst Assessment
The Breakout framework for SEI/USDC presents a borderline case, characterized by a sharp conflict between a constructive daily structure and a restrictive higher-timeframe context. On the daily chart, the technical picture is compelling. For the past month, price has been tightly compressed within a 0.04 to 0.05 range, a classic sign of energy accumulation preceding a potential directional move. The current push towards the 0.05 resistance ceiling is supported by solidifying momentum, with the D1 RSI at a strong 66.28 and the ADX rising to 26.81, suggesting an emerging trend. Recent volume expansion, confirmed by a Volume Oscillator of 40.22, further validates the buying pressure. However, this promising local setup is immediately challenged by two significant obstacles. First, a major resistance confluence sits at 0.06, a level defined by both the daily 200-period EMA and the weekly R1 pivot. This severely limits the immediate space for a breakout to mature. Second, the broader weekly chart remains structurally weak, with price trading far below key moving averages and a weekly RSI of 43.59 indicating persistent underlying weakness. This tension between the clean D1 preparation and the hostile overhead environment is what defines the borderline nature of this breakout opportunity.

Continuation: Directional Flow Assessment
The current market structure presents a classic conflict between short-term bullish momentum and long-term overhead resistance, making a straightforward continuation scenario borderline. On one hand, a recent powerful impulse on the daily chart has broken out of a month-long consolidation range between 0.04 and 0.05. This move is supported by strong momentum indicators, with the D1 RSI at 66.28 and the ADX rising to 26.81, suggesting an emerging trend. However, this nascent rally faces immediate and significant technical hurdles. The price is currently contending with its daily 50-period EMA at 0.05 and is approaching the critical 200-period EMA at 0.06, a level that also aligns with the weekly R1 pivot. Furthermore, the weekly chart provides a sobering context, showing price is still in a long-term downtrend, well below key weekly moving averages. Therefore, while the recent buying pressure is undeniable, its ability to evolve into a stable continuation is questionable until it can decisively clear the 0.06 resistance zone.
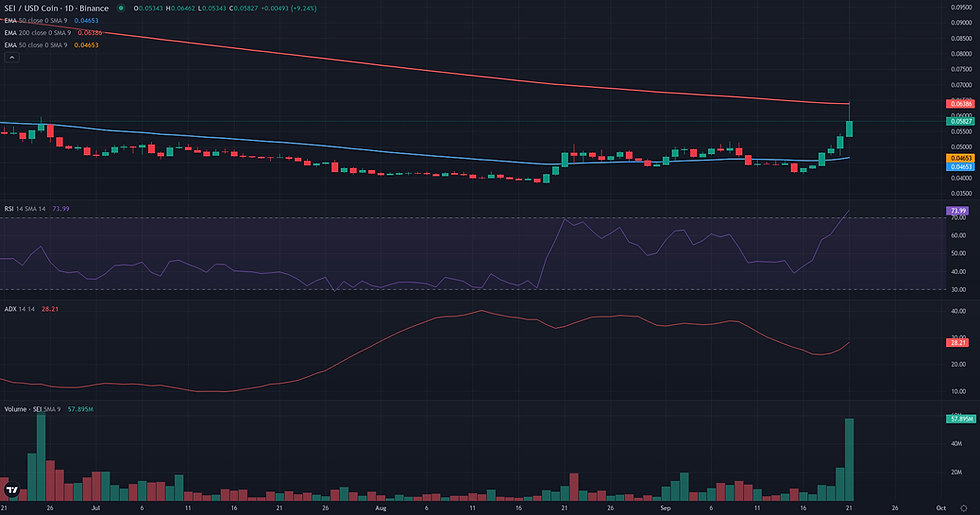
Comparative Framework Verdict
Comparing the three technical frameworks, the Range/Rebound scenario provides the most plausible and complete narrative for the current state of SEI/USDC. Initially validated by a successful bounce from the robust $0.04 support level, this framework has evolved beyond a simple range play. Its exit-phase analysis accurately captures the market's transition into a high-momentum breakout attempt, focusing on the critical test at the $0.06 resistance cluster. This comprehensive view, from range validation to breakout test, makes it the dominant analytical lens. The Breakout and Continuation frameworks are both rated borderline, reflecting a shared core conflict. Both correctly identify the constructive daily momentum but are constrained by the significant overhead resistance at $0.06 and a weak higher-timeframe context. The Breakout framework focuses on clearing the $0.05 range ceiling, while the Continuation framework sets a higher validation bar at the $0.06 structural resistance. Because they describe two facets of the same challenge without a clear distinction in strength, neither emerges as a clear secondary scenario. Ultimately, all three analyses converge on the same critical point: the price interaction with the $0.06 resistance zone. A decisive move above this level would validate a bullish transition, whereas a rejection would likely see momentum fade and could push the price back toward its previous consolidation range.
For broader market context, readers can also review the latest related fundamental analysis for this pair.
For live market monitoring and the full interactive chart, readers can access the dedicated SEI Market Hub.
Disclaimer
CopyTradia provides technical analysis for informational and educational purposes only. This content does not constitute financial advice, investment recommendations, or trading signals. Cryptocurrency markets are highly volatile. Past performance is not indicative of future results. Always conduct your own research (DYOR) and consult a qualified financial advisor before making any investment decisions.


