SEI Range Resistance: Breakout Potential Builds at $0.05

This SEI range resistance examines the current SEI/USDC structure in the context of support defense and weakening alternative frameworks. SEI/USDC is currently consolidating at the key resistance level of 0.05, defining the upper boundary of a well-established horizontal range that has contained price action for over a month. This consolidation follows a rebound from the range support at 0.04. The daily technical indicators present a mixed but constructive picture: the RSI at 60.85 suggests bullish momentum is present, while the ADX at 34.68 indicates a moderately trending environment, creating some tension with the visible range-bound structure. However, this entire daily setup is unfolding within a broader, bearish weekly context, with the price trading significantly below key long-term moving averages. This technical compression at a key resistance level aligns with the latest fundamental analysis, which highlights an expansion in leveraged interest and elevated volatility, suggesting the market is preparing for a significant directional move.
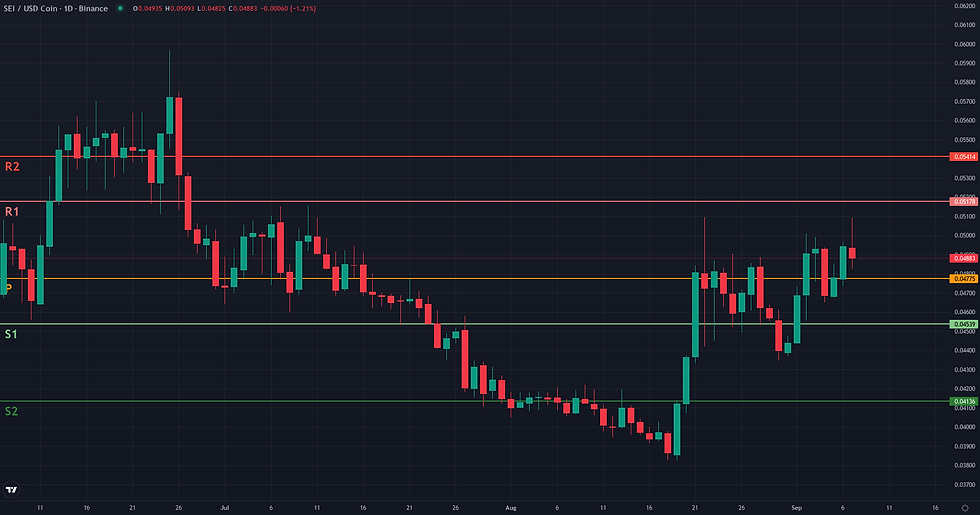
SEI Range Resistance: Support and Friction Zones
The resolution of the Range/Rebound framework for SEI/USDC is currently at a critical juncture. The analysis is anchored in the validation zone of 0.04 to 0.05 USDC, a well-defined daily range. The initial rebound from the 0.04 support has successfully reached the upper boundary at 0.05, and the price is now testing this significant resistance. The framework's coherence will be determined by its ability to resolve from this point. The invalidation zone for this structure is defined by a breakdown of the range itself. A daily close below the 0.04 USDC support would negate the stabilization thesis and signal a potential continuation of the broader downtrend. Conversely, the path upward is met with immediate and significant friction. The primary obstacle is the current 0.05 USDC level, a confluence of the range high, the daily EMA 50, and the weekly pivot point. Should the price manage to break through this area, the next friction zone is located at the daily EMA 200, near 0.06 USDC. If the framework confirms with a breakout, the first technical projection zone is that same daily EMA 200 at 0.06 USDC. A more ambitious, longer-term projection would target the weekly EMA 50 at 0.10 USDC, though this remains a distant macro level. Confirmation of the rebound's strength would require a sustained daily close above 0.05. Conversely, a weakening of the framework would be signaled by a clear rejection from 0.05, leading to a rotation back down inside the range.


Breakout: Structural Catalyst Assessment
The Breakout framework for SEI/USDC presents a borderline case, defined by a sharp contrast between a constructive daily chart and a challenging weekly context. On the daily timeframe, the structure is highly compelling. For over a month, the price has been consolidating within an extremely narrow range, capped by a clear resistance at 0.05. This prolonged compression is visualized by the tight D1 Bollinger Bands (upper 0.05, lower 0.04), suggesting a significant build-up of energy. This structural preparation is supported by healthy momentum, with the D1 RSI at 60.85 and the ADX at 34.68 indicating a strengthening directional bias. However, this optimistic daily picture is tempered by the weekly chart, which remains firmly bearish. Price is trading substantially below long-term averages like the W1 EMA50 (0.10), and the W1 RSI (40.74) shows no sign of a broader trend reversal. This divergence makes the situation ambiguous: while the daily setup for a structural break is text-book, its potential is constrained by the powerful gravitational pull of the weekly downtrend, making the breakout thesis technically present but highly conditional.

Continuation: Directional Flow Assessment
The technical structure for SEI/USDC presents a significant conflict between the daily and weekly timeframes, leading to a borderline assessment for the Continuation framework. On the daily chart, a bullish continuation scenario is taking shape. Following an impulse from 0.04 to 0.05 in early September, the price has entered an extremely tight consolidation precisely at the D1 EMA 50 (0.05). This structure is supported by a trending D1 ADX at 34.68 and a bullish D1 RSI at 60.85, suggesting that the recent upward momentum is intact and could resume. However, this optimistic daily view is heavily challenged by the weekly context. The asset remains in a clear and established weekly downtrend, trading far below key long-term averages like the W1 EMA 50 at 0.10. The weekly RSI of 40.74 confirms this underlying bearish pressure. Therefore, any bullish move on the daily chart must be classified as a counter-trend rally. This lack of higher-timeframe alignment is the primary limiting factor, as it undermines the 'Stable Directional Flow' signature required by the framework. The current H1 price action, completely flat at 0.05, indicates a market coiling for its next move, but the direction remains contested due to the opposing pressures from different timeframes.

Comparative Framework Verdict
Comparing the three technical frameworks, the Range/Rebound scenario emerges as the most plausible. It accurately describes the current, observable market structure: a well-defined horizontal channel between 0.04 and 0.05 USDC. The price is currently testing the upper boundary of this range, which is acting as significant resistance. This framework provides a clear and immediate context for the current price action. The Breakout and Continuation frameworks are both assessed as borderline. They share a common rationale, identifying the constructive daily setup—strong momentum and price compression—as a precursor to a potential upward move. However, their plausibility is significantly tempered by a strong conflict with the weekly timeframe, which remains decidedly bearish. Any upward thrust on the daily chart would be a counter-trend move against this dominant pressure, making a sustained follow-through less certain. From a structural perspective, the market is at a decision point. The primary resistance is the 0.05 level. A decisive rejection from this zone would reinforce the range-bound thesis, while a sustained daily close above it would give credence to the breakout scenario, opening the way towards the next notable resistance near the daily EMA 200 at 0.06. Conversely, a failure to hold the 0.04 support would invalidate the entire bullish daily structure.
For broader market context, readers can also review the latest related fundamental analysis for this pair.
For live market monitoring and the full interactive chart, readers can access the dedicated SEI Market Hub.
Disclaimer
CopyTradia provides technical analysis for informational and educational purposes only. This content does not constitute financial advice, investment recommendations, or trading signals. Cryptocurrency markets are highly volatile. Past performance is not indicative of future results. Always conduct your own research (DYOR) and consult a qualified financial advisor before making any investment decisions.


