SEI Range Rebound Analysis: Support at $0.04 Holds Key

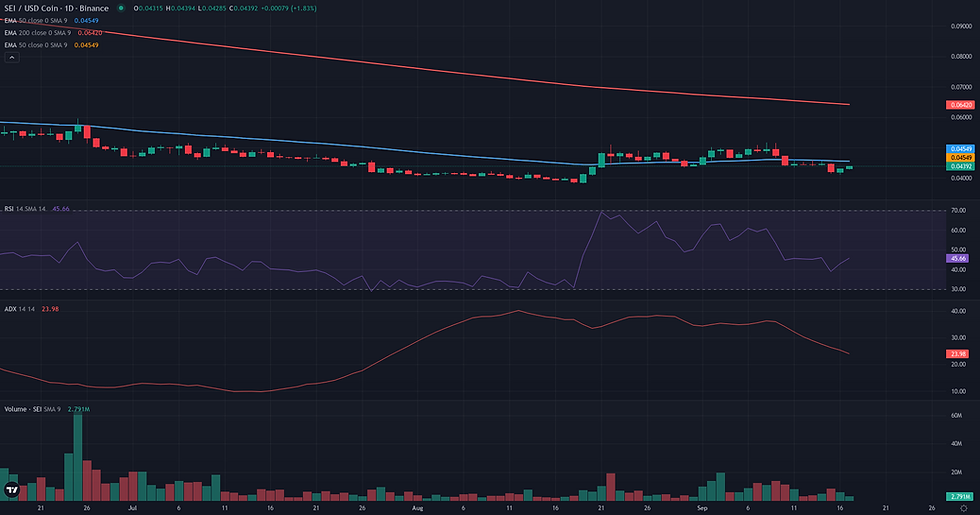
This SEI range rebound analysis examines the current SEI/USDC structure in the context of support defense and weakening alternative frameworks. SEI/USDC is currently defined by a prolonged period of consolidation, with price action tightly contained within a multi-month trading range between the $0.04 support and $0.05 resistance. The market is presently testing the lower boundary of this structure, reflecting a lack of directional conviction. This technical consolidation at range support follows a period of notable price depreciation and weakening short-term momentum, as highlighted in the latest fundamental analysis. Key indicators show a state of equilibrium, with the daily RSI at 43.01 suggesting weak momentum but without being deeply oversold. Meanwhile, the daily ADX at 27.79 points to some underlying trend strength, creating a subtle tension between the observed range-bound behavior and the potential for a more volatile move. The current price level is critical, as it sits at the floor of the established range, making its defense a key factor for the pair's short-term trajectory.

SEI Range Rebound Analysis: Support and Friction Zones
The Range/Rebound framework for SEI/USDC is anchored at the 0.04 validation zone, a critical multi-month support level. The resolution of this framework depends on price successfully defending this floor and initiating a rotation back towards the range's upper boundary. The primary invalidation condition for this scenario would be a structural failure of this support, specifically a D1 close below 0.04. Such a move would signal a breakdown of the established trading range and negate the rebound thesis. For the rebound to gain traction, it must overcome the primary friction zone at 0.05. This level represents a significant confluence of resistance, including the top of the D1 range, the D1 EMA 50, and the weekly pivot point. This 0.05 level also serves as the first logical projection zone for a successful rebound. Should the price clear this area, the next major structural resistance is located at the D1 EMA 200 around 0.06. Currently, the 4H resolution data shows price stabilizing at 0.04 but lacking decisive upward momentum. Confirmation of the rebound would require a clear move away from this support, ideally with rising volume, to demonstrate genuine buying interest. Conversely, the framework would weaken if the price continues to stagnate at 0.04 without bouncing, or if any rally attempts are immediately rejected. The negative 4H Volume Oscillator (-21.12) underscores this current lack of conviction and highlights the risk of failure.


Breakout: Structural Catalyst Assessment
The Breakout framework is currently not plausible for SEI/USDC. The market structure is defined by a clear and prolonged consolidation range between approximately 0.04 and 0.05, a condition often preceding a directional expansion. However, the current price action contradicts the preparatory signals required for a bullish breakout. Instead of pressing against the 0.05 resistance ceiling, the price has fallen back to the 0.04 support level. This lack of upward pressure is corroborated by weak momentum, with the daily RSI at 43.01, well within bearish territory. Furthermore, the broader weekly context presents significant headwinds, as the price remains far below major long-term moving averages such as the W1 EMA50 at 0.10. For this framework to become relevant, the structure would need to shift significantly, requiring price to reclaim the upper part of its range and demonstrate a clear build-up in both momentum and volume against the 0.05 resistance.

Continuation: Directional Flow Assessment
The Continuation framework is currently not plausible for SEI/USDC. The core requirement of this framework is a 'Stable Directional Flow,' which is fundamentally absent in the current market structure. For the past month, the daily chart shows price action confined to a tight, horizontal range between approximately 0.04 and 0.05. This sideways consolidation represents a clear pause in the market, not a directional trend. While the broader weekly context reveals a significant downtrend, with price well below the W1 EMA 50 (0.10), the daily chart is not actively continuing this move. Instead, it shows a state of equilibrium and indecision. This lack of direction is further confirmed by weak momentum indicators, such as a D1 RSI of 43.01, and a negative Volume Oscillator (-8.99), suggesting low participation. For the Continuation framework to become relevant, the market would first need to break out of this range, either by establishing a new uptrend above 0.05 or by decisively resuming the prior downtrend below 0.04.
Comparative Framework Verdict
In the current market structure for SEI/USDC, the three technical frameworks present a very clear hierarchy of plausibility. The Range/Rebound framework stands out as the only viable scenario, rated as plausible due to its alignment with the well-defined trading range between $0.04 and $0.05. With the price currently testing the critical support confluence at the $0.04 floor, and daily momentum indicators showing signs of exhaustion, the conditions for a mean-reversion move back towards the range median are technically coherent. The framework's validity hinges on the defense of this support. Conversely, both the Breakout and Continuation frameworks are deemed not plausible. The Breakout scenario is invalidated by the price's position at the bottom of the range, showing no pressure on the $0.05 resistance ceiling. It lacks the necessary bullish momentum and accumulation signals. Similarly, the Continuation framework fails because the daily chart displays a distinct lack of a directional trend, characterized by sideways consolidation rather than a sustained move. The market is in a clear pause, rendering any trend-following thesis inapplicable. Therefore, analysis should focus on the price action around the $0.04 support, as its stability is the cornerstone of the only currently relevant technical framework.
For broader market context, readers can also review the latest related fundamental analysis for this pair.
For live market monitoring and the full interactive chart, readers can access the dedicated SEI Market Hub.
Disclaimer
CopyTradia provides technical analysis for informational and educational purposes only. This content does not constitute financial advice, investment recommendations, or trading signals. Cryptocurrency markets are highly volatile. Past performance is not indicative of future results. Always conduct your own research (DYOR) and consult a qualified financial advisor before making any investment decisions.


