SEI Range Rebound Analysis: Consolidation Holds Key

This SEI range rebound analysis examines the current SEI/USDC structure in the context of support defense and weakening alternative frameworks. SEI/USDC is currently in a phase of consolidation following a powerful upward impulse, with the price stabilizing around the 0.07 USDC level. This price action reflects a pause in a market that exhibits a strong underlying directional trend, as confirmed by a high Daily ADX reading of 45.88. Momentum remains firmly in bullish territory with the Daily RSI at 66.13, suggesting the recent pullback has not yet damaged the market's underlying strength. This technical picture of a controlled retracement aligns with the latest fundamental context, which describes a period of re-evaluation after a robust 49.41% monthly gain. With price holding above a critical support confluence near 0.06 USDC, which includes key daily moving averages, the current structure sets the stage for several potential bullish resolutions. The market's ability to absorb selling pressure at these levels will be critical in determining the timing and nature of the next directional move.
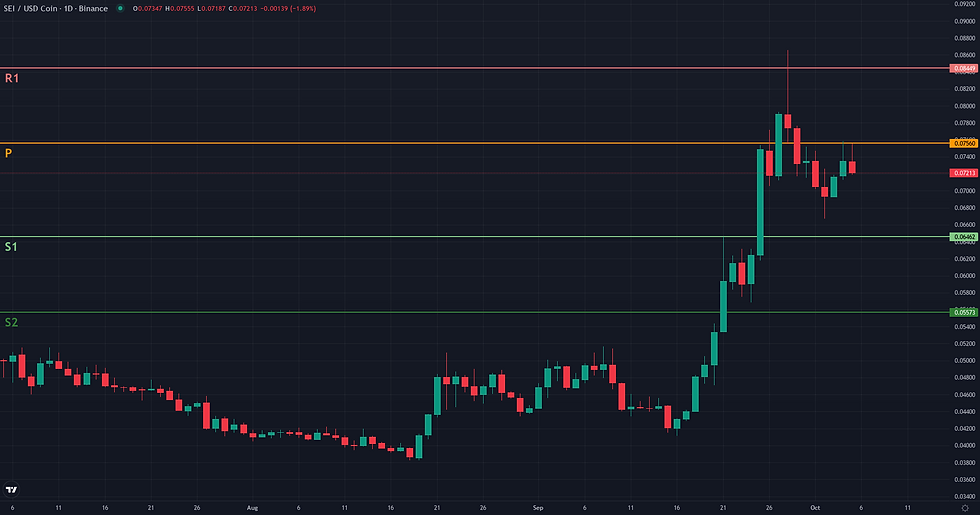
SEI Range Rebound Analysis: Support and Friction Zones
Following the plausible Range/Rebound framework identified in the entry phase, the resolution analysis focuses on the 0.06 - 0.07 USDC validation zone as the potential base for a trend continuation. The current market behavior on the 4H timeframe is one of tight consolidation around 0.07 USDC, characterized by low directional momentum (4H ADX: 19.46), suggesting a temporary equilibrium between buyers and sellers. The framework would lose its structural coherence if the price were to break down decisively. The invalidation zone is therefore defined by a daily close below the 0.06 USDC support cluster. This level is critical as it anchors both the D1 EMA200 and D1 EMA50, and its failure would signal that the recent weekly breakout has failed, shifting the market structure back to neutral or bearish. For the rebound to materialize, buyers must overcome several layers of resistance. The first significant friction zone is located at 0.08 USDC, a confluence of the daily R1 and weekly pivot points. Clearing this hurdle would be the first sign of strength, likely leading to a retest of the recent 0.09 USDC swing high. A confirmed breakout above these levels would shift focus toward higher structural targets. The primary projection zone sits at 0.10 USDC, a level reinforced by the weekly R2 pivot and the W1 EMA50, making it a logical reference point for a successful trend continuation. A confirmation of the rebound would involve a sustained 4H close above 0.08 USDC with expanding momentum. Conversely, the framework would weaken if the price loses the 0.07 USDC handle, signaling a deeper test of the 0.06 support is likely.
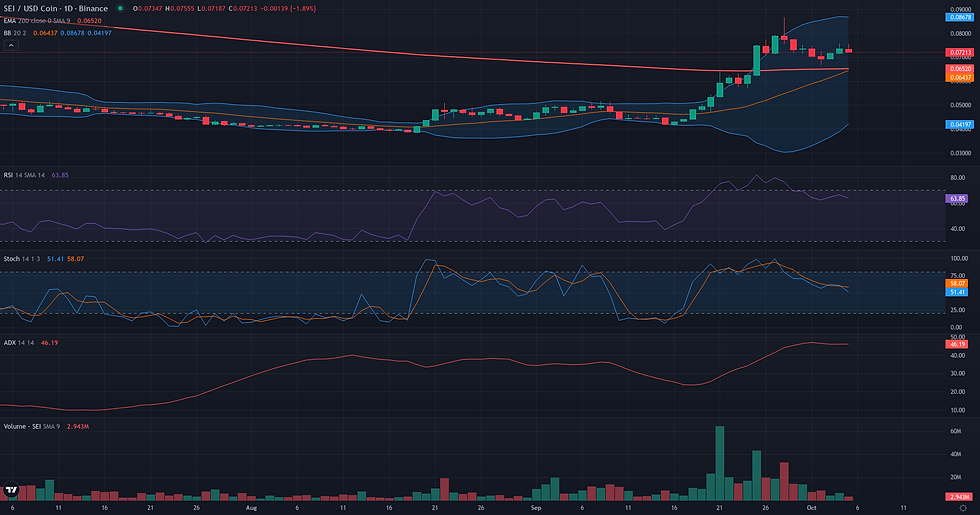

Breakout: Structural Catalyst Assessment
The Breakout framework appears technically plausible for SEI/USDC, centered on a clearly defined market structure on the daily timeframe. Price has established a distinct resistance ceiling at the 0.09 level, a zone confirmed by the Donchian Channel upper band and the recent swing high. Following a strong upward impulse, the market has entered a phase of consolidation, trading in a tight range around 0.07. This compression is accompanied by a significant decrease in volume, a classic signature of energy accumulation before a potential directional move. The underlying dynamic supports this reading, with a high ADX D1 of 45.88 indicating a strong trend is in place, while the RSI D1 at 66.13 shows solid momentum that is not yet overextended. However, two factors warrant caution. The peak at 0.09 was marked by a bearish shooting star pattern, whose influence may not be fully exhausted. Furthermore, the weekly context presents a major resistance level just above the breakout zone, with the W1 EMA 50 located at 0.10, suggesting any upward break could encounter significant friction.
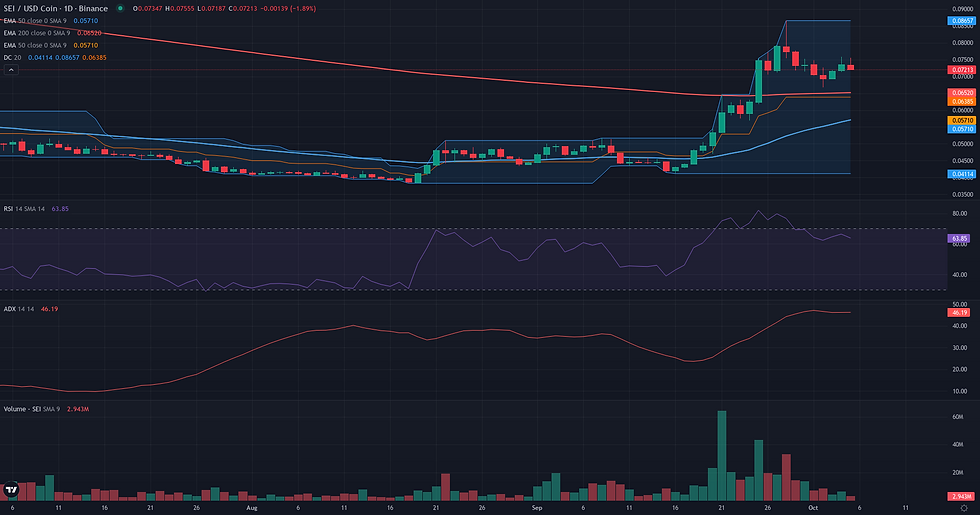
Continuation: Directional Flow Assessment
The technical structure for SEI/USDC presents a plausible case for a bullish continuation. The daily chart is defined by a powerful upward impulse that established a clear directional flow, confirmed by a high ADX reading of 45.88. Following this move, the price has entered a multi-day consolidation phase. This pause appears constructive, characterized by a significant drop in volume (Volume Oscillator: -39.04), which typically suggests a lack of selling pressure rather than a reversal. Price is currently holding above a support confluence around 0.06-0.07, which includes the D1 EMA 50 and the previous week's low. While the daily structure is robust, the weekly context introduces some friction. The price remains below the key EMA 50 W1 at 0.10, and last week's candle closed with a notable upper wick, indicating rejection from the 0.09 high. Despite this long-term resistance, the shift in weekly momentum (RSI W1: 54.70) aligns with the daily trend, supporting the thesis that the current consolidation is a temporary pause before a potential new leg up.
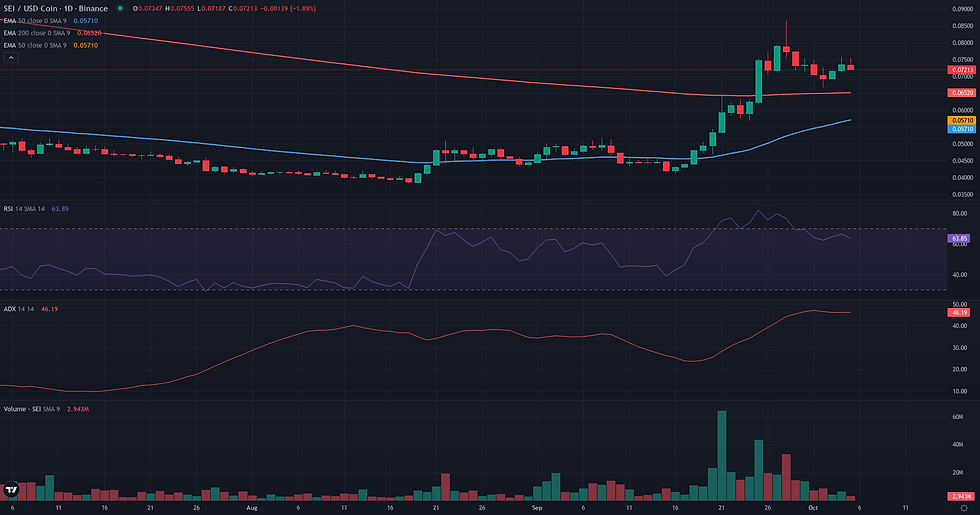
Comparative Framework Verdict
The analysis of SEI/USDC reveals a rare confluence where all three technical frameworks—Range/Rebound, Breakout, and Continuation—are deemed plausible, painting a broadly constructive picture for the asset. Despite this agreement, the Range/Rebound framework emerges as the most dominant. Its strength lies in its detailed focus on the current price action, defining a clear validation zone between 0.06 and 0.07 USDC as the critical support area for the ongoing pullback. This framework provides the most immediate and granular map of the market's test of support. The Continuation framework is a close secondary, sharing the same core thesis of a pause within an uptrend. It validates a resumption of the trend on a move above 0.08 USDC, framing the current consolidation as a precursor to another upward leg. The Breakout framework, while also plausible, is considered the weakest of the three. It is contingent on the success of the other two scenarios, as it requires a decisive push through the 0.09 USDC resistance ceiling. Its plausibility depends on the market first proving that the current support has held. Therefore, the key focus for the coming sessions will be on the price action within the 0.06-0.07 USDC support zone. A successful defense of this area would validate the rebound thesis and set the stage for a potential test of higher resistance levels.
For broader market context, readers can also review the latest related fundamental analysis for this pair.
For live market monitoring and the full interactive chart, readers can access the dedicated SEI Market Hub.
Disclaimer
CopyTradia provides technical analysis for informational and educational purposes only. This content does not constitute financial advice, investment recommendations, or trading signals. Cryptocurrency markets are highly volatile. Past performance is not indicative of future results. Always conduct your own research (DYOR) and consult a qualified financial advisor before making any investment decisions.


