SEI Range Rebound Analysis: Extreme Price Compression at $0.05

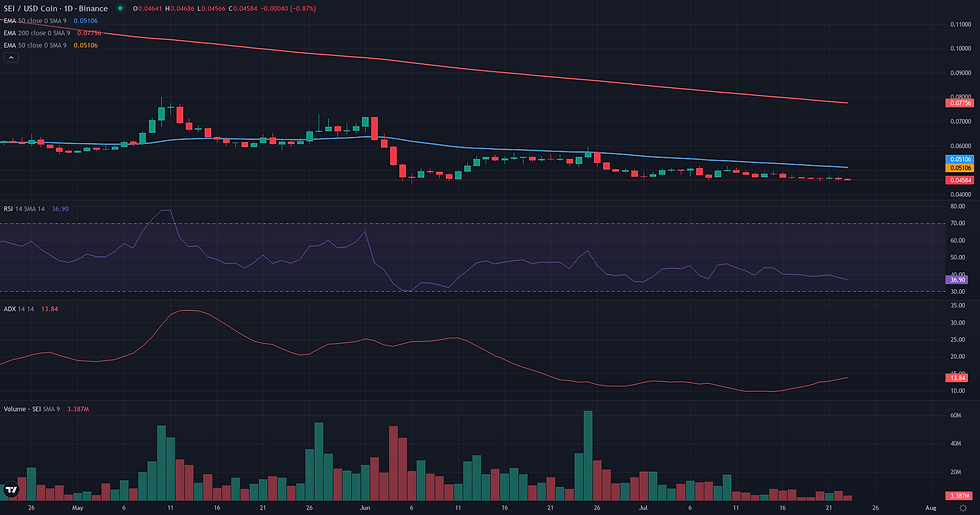
This SEI range rebound analysis examines the current SEI/USDC structure in the context of support defense and weakening alternative frameworks. SEI/USDC is currently in a state of extreme technical consolidation, with its price locked at the $0.05 level for nearly a month. This prolonged period of inertia is quantitatively confirmed by a very low Daily ADX of 13.30, indicating a complete absence of a directional trend, and a significant contraction in volume. While daily momentum indicators like the RSI remain in bearish territory at 38.21, the sheer duration of this sideways price action at a key support level suggests a market building energy for its next significant move. This technical stasis aligns with recent fundamental analysis, which points to a low-volatility regime coupled with a persistent bearish bias in speculative positioning, suggesting the current calm may be masking underlying market tension. The current structure is a classic precursor to volatility expansion, setting the stage for the strategic frameworks that follow.
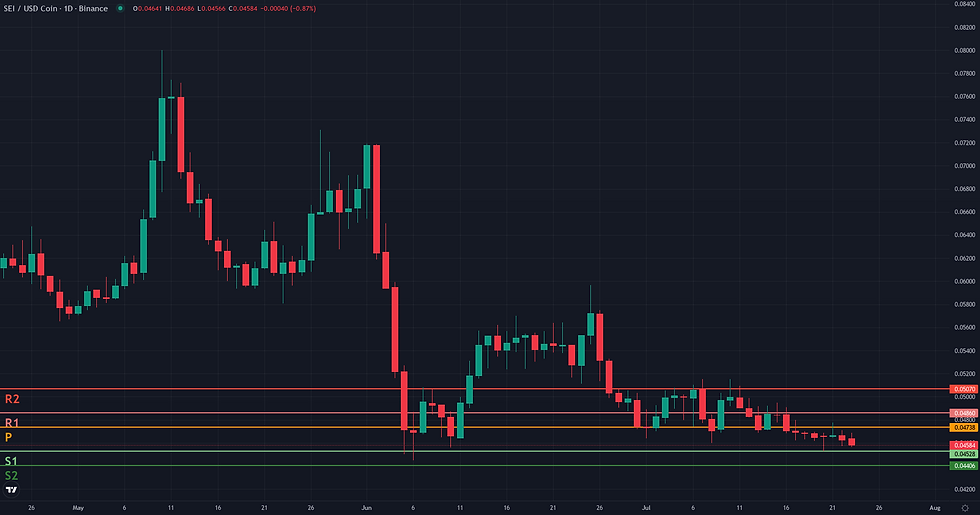
SEI Range Rebound Analysis: Support and Friction Zones
The Range/Rebound framework for SEI/USDC hinges on the resolution of an exceptionally tight and prolonged price compression around the 0.05 USDC level. Starting from the validation condition of a sustained daily close above this static zone, the potential resolution path is clearly defined by key structural levels. The invalidation zone for this rebound scenario is a definitive breakdown below the current support. A daily close under the June low of 0.04 USDC, which also corresponds to the D1 S2 pivot, would signal that the month-long consolidation has failed, invalidating the rebound thesis and suggesting a continuation of the prior downtrend. Should the framework validate with a move upwards, the first area of friction is expected at 0.06 USDC. This level acted as the floor for the range throughout May and June and is the first logical point of potential resistance. Overcoming this hurdle would be a strong sign of confirmation, suggesting buyers have absorbed the local supply. Beyond this friction zone, the primary technical projection is the daily EMA 200, currently located at 0.08 USDC. This level represents a significant structural resistance and a logical target for a successful rebound. A weakening of the framework would be observed if the price breaks above 0.05 only to be immediately rejected, or if it stalls and fails at the 0.06 friction zone, indicating insufficient buying pressure to sustain momentum.
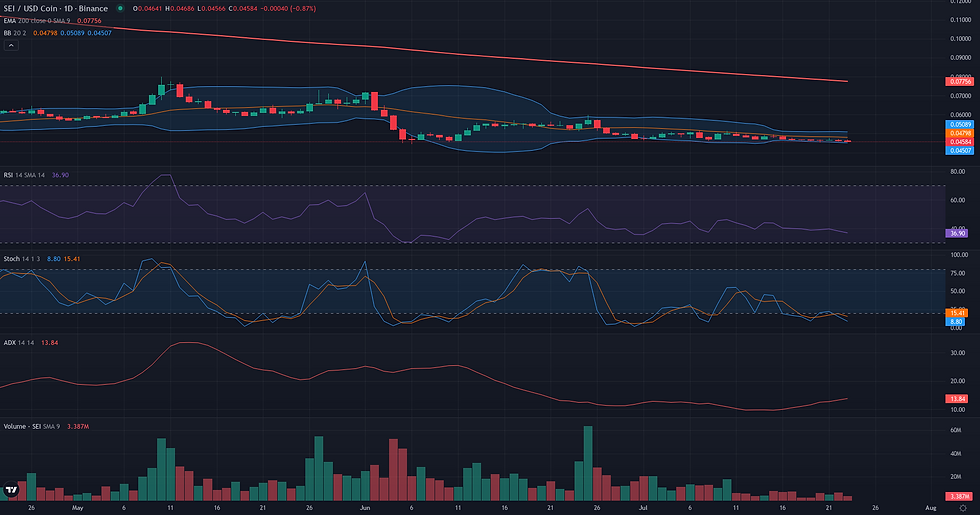
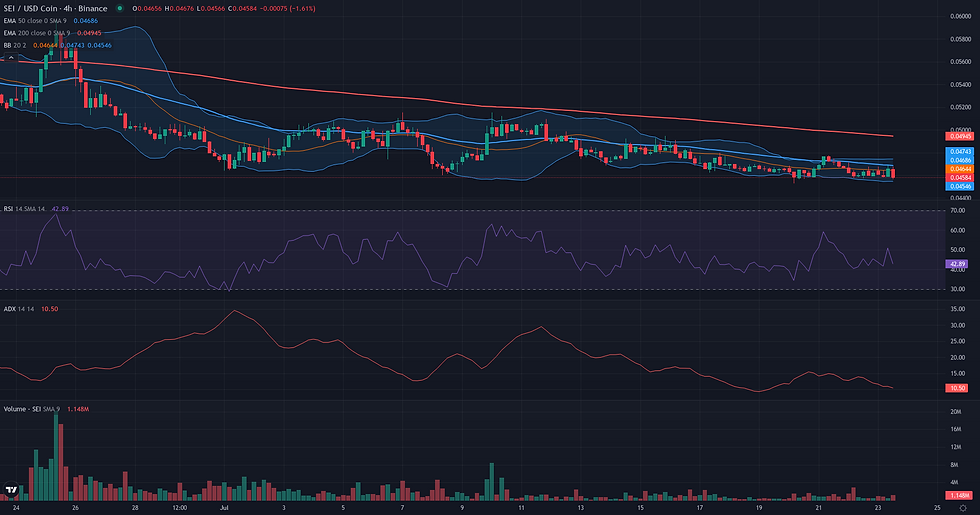
Breakout: Structural Catalyst Assessment
The Breakout framework is currently not plausible for SEI/USDC. The daily chart displays an exceptional state of compression, with price action flatlining at 0.05 for over three weeks. This is confirmed by Bollinger Bands that have completely collapsed to the same level and a D1 ADX reading of 13.30, signaling an absolute lack of trend and a severe volatility squeeze. While such compression often precedes a significant price move, the broader context provides a strong directional counter-argument to a bullish breakout. The weekly chart reveals a dominant and established downtrend, evidenced by a high ADX of 35.78 and price trading far below key moving averages like the W1 EMA50 at 0.12. Furthermore, momentum indicators are weak, with both the D1 RSI (38.21) and W1 RSI (34.12) residing in bearish territory. This combination suggests the current daily consolidation is more likely a pause within a larger downtrend than a base for a bullish reversal. For the Breakout framework to become relevant, a clear structural shift would be required, including a move above the recent range, a recovery in momentum, and a notable increase in volume.
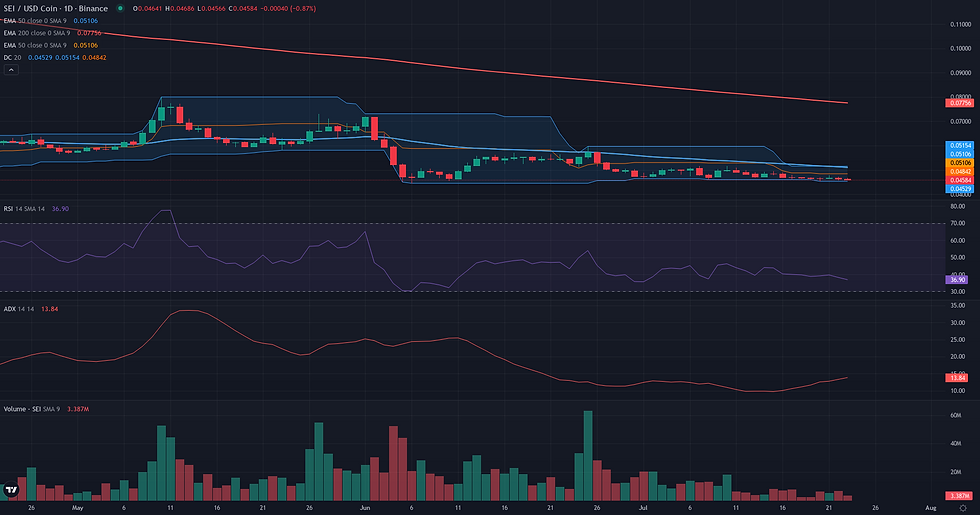
Continuation: Directional Flow Assessment
The Continuation framework is assessed as not plausible for SEI/USDC at this time. The primary reason is the complete absence of a directional trend on the daily timeframe, which is a fundamental prerequisite for this strategy. The market structure is not one of 'Stable Directional Flow' but rather one of extreme inertia and consolidation. For the past three weeks, price action has been entirely flat, with daily closes consistently at the 0.05 level. This visual observation is quantitatively confirmed by a critically low ADX D1 reading of 13.30, which denotes a non-trending market. Compounding this lack of direction is a significant deficit in market energy; the Volume Oscillator D1 is negative at -36.34, and daily volatility (NATR D1 at 4.79) is highly compressed. While the weekly context does show a preceding strong bearish trend (ADX W1 at 35.78), the current daily structure is a prolonged pause, not an active continuation. For this framework to become relevant, the market would first need to break out of this tight range and establish a new, clear directional impulse.
Comparative Framework Verdict
Comparing the three technical frameworks, the market's prolonged state of consolidation provides a clear verdict. The Range/Rebound framework emerges as the only plausible scenario. Its relevance is rooted in the exceptional price compression around the $0.05 support level, a zone reinforced by the weekly S1 pivot. The framework correctly identifies the current structure as a potential bottoming formation, supported by signs of seller exhaustion such as oversold daily stochastics and a significant dry-up in volume. Conversely, both the Breakout and Continuation frameworks are assessed as not plausible. The Continuation framework is invalidated by its core requirement for a stable directional flow, which is entirely absent in the current flat market, as confirmed by a D1 ADX of 13.30. The bullish Breakout framework is similarly discounted due to the overwhelmingly bearish weekly context and a lack of any discernible buying momentum. The current consolidation appears more as a pause within a larger downtrend than a base for a bullish reversal. Therefore, the Range/Rebound scenario provides the most coherent lens for analysis. Its invalidation is clearly defined by a daily close below the June low of $0.04, while a sustained move above the $0.05 static level, and subsequently the $0.06 friction zone, would be the first confirmation of a potential recovery.
For broader market context, readers can also review the latest related fundamental analysis for this pair.
For live market monitoring and the full interactive chart, readers can access the dedicated SEI Market Hub.
Disclaimer
CopyTradia provides technical analysis for informational and educational purposes only. This content does not constitute financial advice, investment recommendations, or trading signals. Cryptocurrency markets are highly volatile. Past performance is not indicative of future results. Always conduct your own research (DYOR) and consult a qualified financial advisor before making any investment decisions.


