SEI Range Rebound Analysis: Extreme Consolidation at $0.05

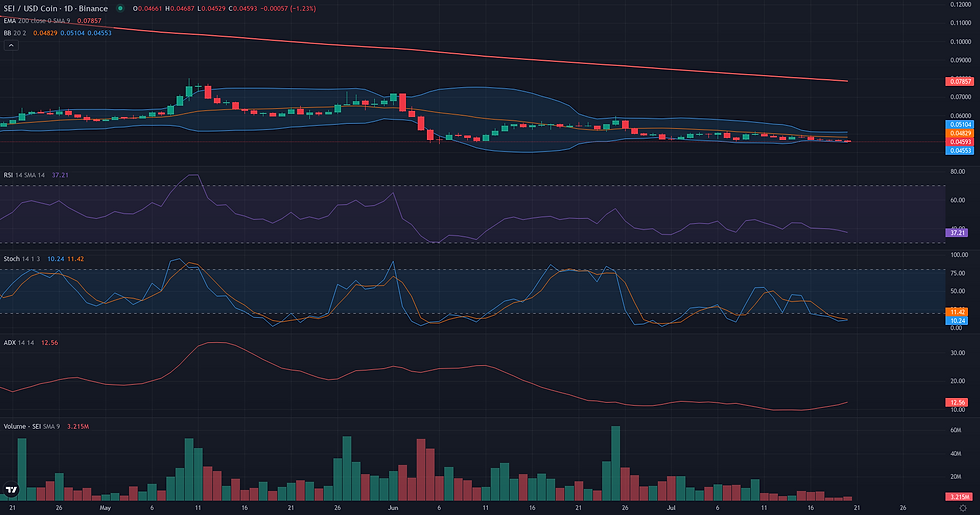
This SEI range rebound analysis examines the current SEI/USDC structure in the context of support defense and weakening alternative frameworks. The SEI/USDC market is currently in a state of extreme hibernation, characterized by a multi-week price consolidation locked at the 0.05 USDC level. This prolonged sideways movement has led to a collapse in volatility, with daily indicators reflecting complete market indecision. The ADX on the daily timeframe sits at an exceptionally low 11.65, confirming the absence of any discernible trend, while the RSI at 38.80 indicates a persistent lack of bullish momentum. This technical stagnation aligns with the latest market dynamics analysis, which points to a low-volatility regime coupled with a persistent bearish bias in speculative positioning. However, this daily calm is set against the backdrop of a strong, established weekly downtrend, creating a significant tension between short-term stability and long-term bearish pressure. The current structure therefore presents a critical question: is this a base for a future rebound or simply a pause before the next downward leg?

SEI Range Rebound Analysis: Support and Friction Zones
The resolution of the SEI/USDC Range/Rebound framework depends entirely on the breakout direction from its state of extreme hibernation at 0.05 USDC. The validation for a potential rebound is set at a daily close above this multi-week consolidation ceiling. However, the path forward is defined by several critical technical zones derived from the broader market structure. The invalidation zone for this framework is structurally straightforward: a daily close below the 0.05 USDC support level. Such a breakdown would shatter the stabilization that has been in place for nearly a month, invalidating the rebound hypothesis and likely signaling a continuation of the powerful weekly downtrend. Should the framework validate to the upside, it will encounter immediate friction. The first obstacle is the 0.06 - 0.07 USDC area, which acted as resistance during the earlier phases of the consolidation in June. A more formidable barrier is the D1 EMA 200, currently positioned at 0.08 USDC. This long-term moving average represents a significant structural resistance that must be overcome for any rebound to be considered sustainable. If the market can clear these friction zones, the primary projection zone comes into view at the W1 EMA 50, located at 0.12 USDC. Reaching this level would imply a significant shift in the market's trend structure. Confirmation of the rebound's strength will require not just a break of 0.05, but a sustained move with volume through the friction zones. Conversely, a false breakout that quickly returns to the 0.05 range would be a significant weakening signal, suggesting the underlying bearish pressure remains dominant.

Breakout: Structural Catalyst Assessment
The Breakout framework is currently not plausible for SEI/USDC. The daily chart displays an extreme case of price compression, with the price having remained static at 0.05 for nearly three weeks. This has flattened key volatility indicators like the Bollinger Bands and Donchian Channels, creating a state of market dormancy rather than a preparatory consolidation beneath a clear resistance. The primary obstacle to a breakout reading is the complete absence of directional energy, evidenced by a D1 ADX of just 11.65. This lack of momentum is corroborated by a deeply negative Volume Oscillator (-54.82), signaling disinterest. Furthermore, the weekly context provides significant headwinds; the price is trading substantially below major resistance levels such as the W1 EMA50 at 0.12, within a strong, established downtrend confirmed by a W1 ADX of 35.78. For this framework to become relevant, the market would first need to exit its current state of stagnation, establish a clear resistance level, and demonstrate a significant build-up in both momentum and volume.

Continuation: Directional Flow Assessment
The Continuation framework is deemed not plausible for SEI/USDC at this time due to the market's complete shift from a trending to a non-directional state. The core requirement for this framework is a 'Stable Directional Flow,' which is fundamentally absent. For the past 30 days, the daily price has been locked in an extremely tight consolidation range around the 0.05 level, with minimal volatility and declining volume (Volume Oscillator D1: -54.82). This prolonged sideways movement is confirmed by a very low ADX D1 of 11.65, a reading that signals a lack of any discernible trend. While the weekly chart reveals a preceding bearish trend (ADX W1: 35.78) with price well below key long-term averages like the EMA 200 W1 (0.34), the daily structure does not represent a continuation of this move. Instead, it shows a clear and extended pause. The H1 micro-view reinforces this observation, showing a flat line with no price fluctuation over the last 48 hours. For the Continuation framework to become relevant, the market would first need to break out of this consolidation, establishing a new directional impulse either by breaking below the 0.05 support or reclaiming higher structural levels.

Comparative Framework Verdict
Comparing the three technical frameworks, the market's state of extreme consolidation renders only one partially relevant. The Range/Rebound framework is assessed as borderline, while both the Breakout and Continuation frameworks are deemed not plausible. The Range/Rebound framework, while speculative on the 'rebound' component, accurately captures the primary characteristic of the current market: a multi-week, low-volatility range centered at 0.05 USDC. Its borderline status stems from the conflict between this daily stability and the powerful underlying weekly downtrend, which weakens the case for a significant bounce. In contrast, both the Breakout and Continuation frameworks fail because they require a directional trend on the daily timeframe, which is fundamentally absent. The D1 ADX reading of 11.65 confirms the market is dormant, not consolidating in preparation for a breakout or actively continuing a trend. The current price action is a full stop, not a pause in a directional move. The resolution of this structure hinges on the 0.05 level. A confirmed break below would invalidate the range thesis and align with the broader bearish context, whereas a move above would need to challenge immediate resistance zones to prove its sustainability. The key element to monitor will be the direction and volume of the eventual move out of this prolonged compression.
For broader market context, readers can also review the latest related fundamental analysis for this pair.
For live market monitoring and the full interactive chart, readers can access the dedicated SEI Market Hub.
Disclaimer
CopyTradia provides technical analysis for informational and educational purposes only. This content does not constitute financial advice, investment recommendations, or trading signals. Cryptocurrency markets are highly volatile. Past performance is not indicative of future results. Always conduct your own research (DYOR) and consult a qualified financial advisor before making any investment decisions.


