SEI Price Compression Analysis: Rebound vs. Continuation

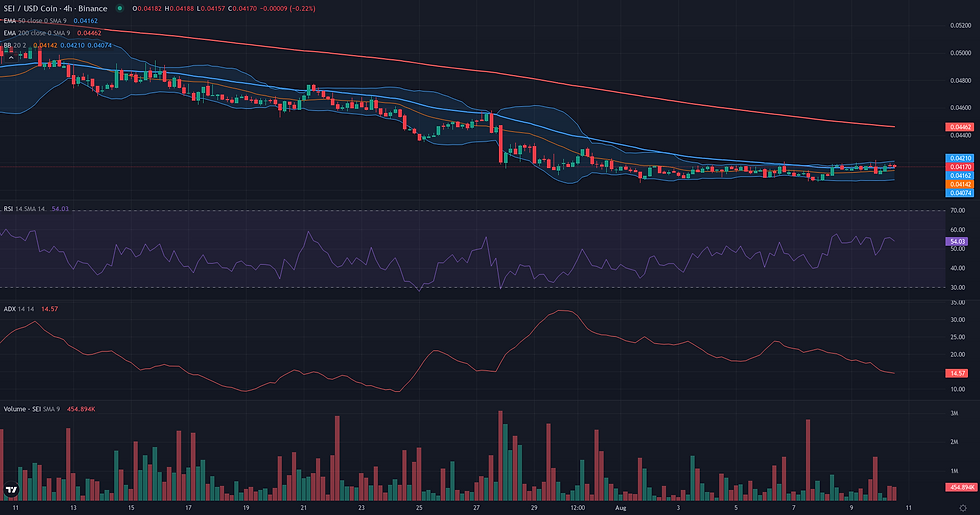
This SEI price compression analysis examines the current SEI/USDC structure in the context of support defense and weakening alternative frameworks. SEI/USDC is currently defined by an extreme state of price compression, with the daily close pinned at the 0.04 level for over two weeks. This prolonged consolidation has driven volatility to a minimum, as evidenced by a tight Bollinger Band squeeze and a low NATR reading of 3.76. The market's momentum remains decidedly bearish, with the daily RSI at 35.60, reflecting the broader downtrend that has pushed the price well below key moving averages like the D1 EMA 200 at 0.07. The high ADX reading of 36.73, while likely a lagging indicator of the prior sell-off, underscores the strength of the prevailing bearish macro structure. This technical stasis aligns with the latest fundamental analysis for this pair, which highlights subdued volatility and a build-up of short-biased derivatives positioning, suggesting underlying pressure despite the recent price stabilization. The current structure therefore presents a critical inflection point, where this balance between stabilization and underlying trend pressure is set to resolve.

SEI Price Compression Analysis: Technical Framework Assessment
The resolution of the Range/Rebound framework for SEI/USDC is anchored to the extreme multi-week consolidation at 0.04 USDC. Starting from the validation condition of a sustained daily close above this level, the framework's coherence depends on breaking this inertia. The invalidation zone is clearly defined: a daily close below the 0.04 support would negate the stabilization thesis and signal a probable continuation of the macro downtrend. The current price action, as seen in the 4H data, shows a complete lack of trend (ADX 4H: 14.77), underscoring the significance of the first directional break. Should the rebound initiate, it will immediately face a critical friction zone at 0.05 USDC. This level is not arbitrary; it represents the floor of the previous trading range throughout June and July and now converges with the D1 EMA 50, making it the first major test for buyers. Overcoming this barrier is essential for the framework to gain credibility. If the rebound sustains momentum, technical projection zones can be identified at higher structural levels. The first reference point is the 0.06 USDC area, which marked the upper boundary of the June consolidation. A more significant projection lies at 0.07 USDC, the location of the D1 EMA 200, which often acts as a powerful magnet for mean-reversion moves within a larger bear market. Confirmation of the rebound would involve clearing the 0.05 friction zone, while a failure to break above 0.04 or an immediate rejection would serve as a primary weakening signal.

Breakout: Structural Catalyst Assessment
The market structure for SEI/USDC presents a classic but conflicted scenario for a potential breakout. On the daily chart, the price has entered a phase of extreme compression, trading in a flat line at 0.04 for over two weeks. This consolidation has created a textbook Bollinger Band Squeeze, a condition that often precedes a significant expansion in volatility. The ceiling of this compression is a very clearly defined resistance zone at 0.05, a level reinforced by multiple technical indicators including the 20-day Donchian Channel upper band, the upper Bollinger Band, and the 50-day EMA. This structural preparation is a key element supporting the breakout framework. However, this potential is significantly tempered by a lack of directional momentum and a challenging weekly context. The daily RSI, at 35.60, remains firmly in bearish territory, showing no signs of the underlying buying pressure typically needed to fuel a sustained break. Furthermore, the weekly chart reveals a dominant and protracted downtrend, with the price trading far below key moving averages like the 50-week EMA at 0.11. This broader bearish environment suggests that any upward move could face substantial resistance. The current situation is therefore one of structural readiness clashing with bearish momentum, rendering the breakout framework borderline until a clear shift in buying interest emerges.

Continuation: Directional Flow Assessment
The current market structure presents a plausible scenario for a bearish continuation, characterized by a prolonged consolidation phase within a firmly established downtrend. On both daily and weekly timeframes, the price at 0.04 remains significantly below key moving averages such as the D1 EMA 50 (0.05) and the W1 EMA 50 (0.11), confirming a strong bearish control. This directional bias is further substantiated by high ADX readings on both D1 (36.73) and W1 (35.74), which indicate that the underlying trend possesses significant strength despite the recent lack of price movement. The current daily price action is a tight, multi-week range, accompanied by declining volume (Volume Oscillator: -28.41) and low volatility (NATR D1: 3.76). This behavior is typical of a pause or energy consolidation before a potential resumption of the primary trend. The main qualifying factor is the extreme duration of this stasis, which challenges the concept of 'directional flow' but ultimately fits the technical definition of a continuation pattern awaiting resolution.

Comparative Framework Verdict
The analysis of SEI/USDC reveals a market at a clear decision point, with two opposing frameworks—Range/Rebound and Continuation—emerging as equally plausible, while the Breakout scenario is considered borderline. This tension stems from an extended period of price consolidation at the critical 0.04 support level. The Range/Rebound framework is deemed plausible due to the strength of this 0.04 support, which represents a confluence of weekly technical floors. This stabilization is supported by signs of selling momentum exhaustion, such as deeply oversold D1 Stochastics, suggesting the potential for a technical bounce from a well-defended base. Conversely, the bearish Continuation framework is also plausible, interpreting the current flat price action as a temporary pause within a powerful, multi-timeframe downtrend. This view is supported by high ADX readings and the price remaining significantly below all major daily and weekly moving averages. The Breakout framework is the weakest of the three. While the price compression creates the structural precondition for a breakout, the scenario lacks the necessary bullish momentum, with the RSI remaining firmly in bearish territory. Consequently, no single framework is dominant. The market is coiled, and the key factor to monitor will be the direction of the eventual break from the 0.04 price level, which will likely validate one of the two primary scenarios and dictate the next significant move.
For broader market context, readers can also review the latest related fundamental analysis for this pair.
For live market monitoring and the full interactive chart, readers can access the dedicated SEI Market Hub.
Disclaimer
CopyTradia provides technical analysis for informational and educational purposes only. This content does not constitute financial advice, investment recommendations, or trading signals. Cryptocurrency markets are highly volatile. Past performance is not indicative of future results. Always conduct your own research (DYOR) and consult a qualified financial advisor before making any investment decisions.


