SEI Breakout Resistance Test: Price Challenges 0.06 Level

This SEI breakout resistance test examines the current SEI/USDC structure in the context of support defense and weakening alternative frameworks. SEI/USDC has undergone a significant structural shift, breaking decisively from a multi-week consolidation phase between 0.04 and 0.05. The price is now challenging the critical 0.06 level, which coincides with the long-term D1 EMA 200 resistance. This upward move is supported by strong technical indicators, including a daily RSI in overbought territory at 75.74 and a D1 ADX of 31.44, confirming a strengthening trend. The breakout was also accompanied by a surge in volume, with the Volume Oscillator reaching 76.39, indicating significant market participation. This technical breakout aligns with recent fundamental observations of renewed market momentum and a surge in speculative positioning, suggesting the current test of resistance is a critical juncture for the pair. The market now stands at a decision point, where the strength of this new daily momentum is being tested against a major long-term structural barrier.
Range & Rebound: Market Structure Assessment
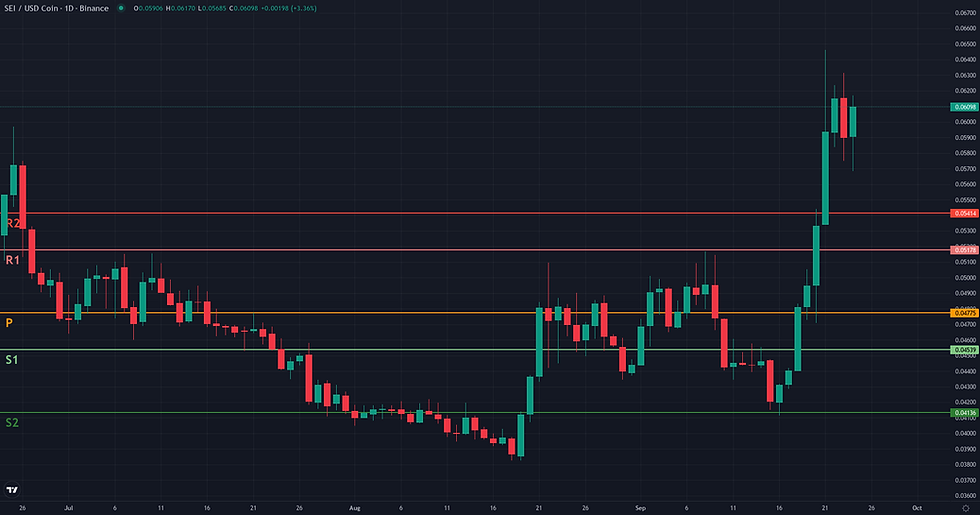
The Range/Rebound framework is assessed as not plausible for SEI/USDC at this time. The market structure has moved beyond the conditions this framework seeks to identify. While a rebound did initiate from the 0.04 support level, it has since evolved into a decisive breakout, pushing the price to 0.06. The current context is one of bullish expansion, not stabilization at a range low. This is confirmed by multiple indicators: the D1 RSI (75.74) and Stochastics (85.44) are firmly in overbought territory, and the D1 ADX (31.44) signals a strengthening trend. Furthermore, the price is currently challenging the D1 Upper Bollinger Band and the significant long-term resistance of the D1 EMA 200 at 0.06. This configuration is diametrically opposed to the 'Controlled Reversal' signature, which requires a slowdown in momentum near a support zone. For the framework to become relevant again, the market would need to either fail its breakout attempt and reintegrate the previous 0.04-0.05 range, or establish a new, clear consolidation pattern at current levels.
SEI Breakout Resistance Test: Structural Catalyst Assessment
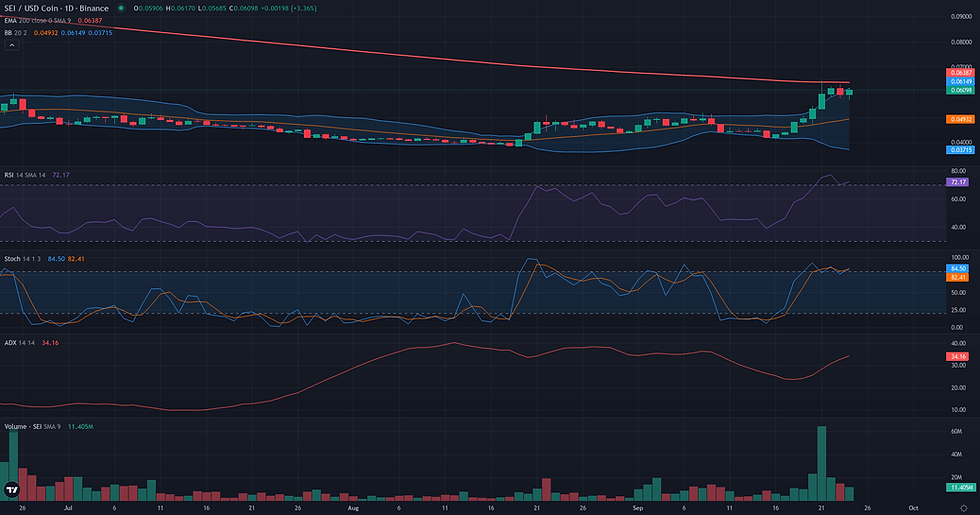
The Breakout framework appears technically plausible for SEI/USDC, centered on a highly defined daily chart structure. For nearly a month, the price was contained within a narrow consolidation range, primarily between 0.04 and 0.05 USDC, indicating a phase of equilibrium and energy compression. This period of low volatility has been decisively broken by a sharp upward impulse, which saw the price challenge the key long-term resistance at 0.06 USDC. This level is particularly significant as it corresponds precisely with the D1 EMA 200. The technical credibility of this move is reinforced by a massive volume spike, reflected in a Volume Oscillator D1 of 76.39, and strong supporting momentum, with the D1 RSI at 75.74 and the ADX at 31.44. However, this bullish daily setup faces considerable friction from the weekly context. The asset remains in a clear long-term downtrend on the weekly chart, trading well below its W1 EMA 50 (0.10). This timeframe divergence is the primary limiting factor, suggesting any breakout could be a counter-trend move with potential headwinds. Despite this, the clarity of the D1 compression and the forceful test of a major resistance make the breakout structure itself highly relevant for analysis.

Continuation: Directional Flow Assessment
The technical structure for a bullish continuation is currently borderline, defined by a sharp conflict between recent powerful momentum and a significant long-term resistance. On one hand, the daily chart displays a compelling breakout from a consolidation range around 0.05. This move is supported by strong technical readings: the RSI D1 is high at 75.74, the ADX D1 at 31.44 confirms trend strength, and the Volume Oscillator D1 at 76.39 indicates robust participation. However, this bullish impulse has met a formidable obstacle, stalling precisely at the D1 EMA 200, located at 0.06. The price has been consolidating at this level for the last 48 hours, with H1 micro-data showing a significant cooling of momentum. This pause at a major resistance, coupled with a weekly context that remains structurally weak with price far below its key moving averages, casts doubt on the immediate viability of a stable continuation. The framework's plausibility hinges entirely on whether the current bullish pressure can decisively overcome this 0.06 resistance.

Comparative Framework Verdict
Comparing the three technical frameworks, the Breakout scenario presents the most plausible interpretation of the current market structure for SEI/USDC. It accurately captures the recent price action: a prolonged period of compression between 0.04 and 0.05, followed by a high-volume expansion to test the well-defined D1 EMA 200 resistance at 0.06. This clarity makes it the dominant framework for analysis. The Continuation framework is assessed as borderline and serves as a secondary scenario. While it acknowledges the powerful daily momentum driving the price upward, its plausibility is tempered by the fact that the price has stalled precisely at this major resistance. The uncertainty regarding whether the trend can sustain itself through this barrier makes it a less definitive, though still relevant, perspective. Finally, the Range/Rebound framework is considered not plausible. The market has clearly transitioned out of the range-bound conditions this framework requires. The strong directional momentum and the challenge of a key resistance level are characteristic of a trending or breakout environment, not a rebound from a range low. The key factor to watch going forward is whether the price can achieve a daily close above the 0.06 resistance, which would validate the breakout and continuation theses, or if it will be rejected, potentially signaling buyer exhaustion.
For broader market context, readers can also review the latest related fundamental analysis for this pair.
For live market monitoring and the full interactive chart, readers can access the dedicated SEI Market Hub.
Disclaimer
CopyTradia provides technical analysis for informational and educational purposes only. This content does not constitute financial advice, investment recommendations, or trading signals. Cryptocurrency markets are highly volatile. Past performance is not indicative of future results. Always conduct your own research (DYOR) and consult a qualified financial advisor before making any investment decisions.


