SEI Bearish Continuation: Breakdown Below $0.05 Support

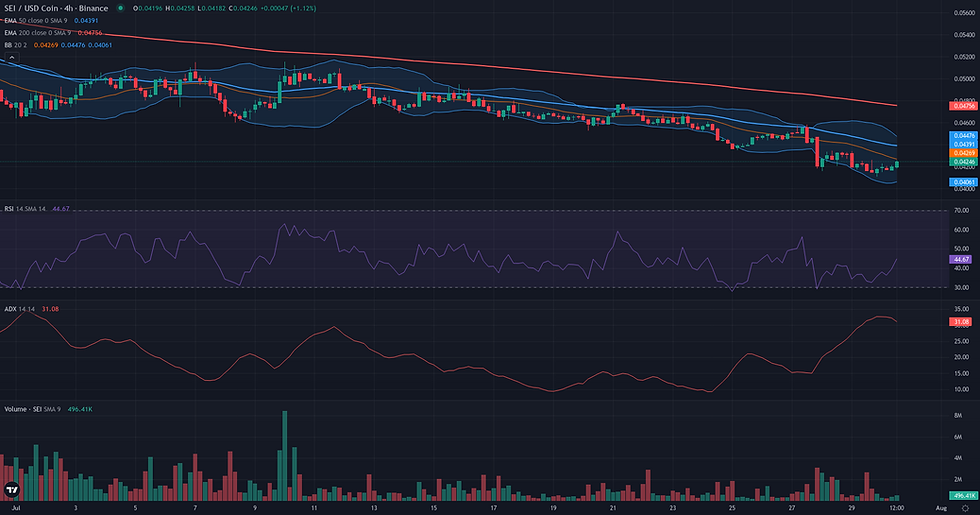
This SEI bearish continuation examines the current SEI/USDC structure in the context of support defense and weakening alternative frameworks. SEI/USDC is currently in a decidedly bearish technical posture, consolidating at its weekly lows around $0.04 after a significant structural breakdown of the multi-week support at $0.05. The price remains well below key long-term moving averages, including the daily EMA 200 at $0.08 and the weekly EMA 50 at $0.12, confirming a strong underlying downtrend. Momentum is weak, with the daily RSI at 31.07 indicating proximity to oversold conditions but without suggesting an imminent reversal. This technical setup, marked by a recent structural breakdown, aligns with the latest market dynamics analysis which highlighted a period of subdued volatility and consolidation rather than strong directional conviction. The current price action represents a critical juncture, testing a major support floor while the broader trend structure continues to favor sellers, setting the stage for the conflicting technical frameworks detailed below.

Range & Rebound Resolution: Support and Friction Zones
Following the borderline assessment, the resolution of the SEI/USDC range rebound framework depends on its ability to reclaim the 0.05 level, the validation zone defined as a daily close above this price. The current market structure presents a tense standoff between a major support floor and a formidable resistance ceiling. The invalidation zone for this rebound scenario is clearly defined by a daily close below the 0.04 support cluster. This level represents a critical weekly low, and a breakdown would nullify the stabilization thesis, signaling a likely continuation of the prevailing macro downtrend. The path higher faces immediate and significant friction. The primary obstacle is the 0.05 level itself. This former multi-week support has now flipped to resistance and is heavily reinforced by a confluence of technical indicators, including the D1 EMA 50 and the entire weekly pivot range (W1 Pivot, R1, and R2 are all clustered at 0.05). Overcoming this dense resistance is the first condition for the framework to gain credibility. Should the price clear this zone, the next friction point lies at 0.06, the upper boundary of the prior consolidation range. If the rebound confirms and sustains momentum, the main technical projection zone is the area around 0.08, which aligns with the D1 EMA 200. Reaching this level would constitute a significant counter-trend recovery. The framework's coherence will weaken if the price fails to bounce from 0.04 and remains pinned below 0.05, while confirmation would require turning 0.05 back into a solid support base.

Breakout: Structural Catalyst Assessment
The Breakout framework is currently not plausible for SEI/USDC. The market structure does not exhibit the necessary characteristics of a pre-breakout compression. Instead of consolidating beneath a key resistance, the price has recently broken down from a prolonged support level at 0.05, which has now become the immediate ceiling. This structural breakdown is reinforced by deeply bearish momentum indicators, with the daily RSI at 31.07 suggesting a clear lack of buying pressure. Furthermore, the broader weekly context is unequivocally negative; the price is trading significantly below its key long-term moving averages, such as the D1 EMA200 at 0.08 and the W1 EMA50 at 0.12, within a strong, established downtrend confirmed by a W1 ADX of 35.64. For a bullish breakout scenario to become relevant, the price would first need to reclaim the 0.05 level and establish a clear consolidation phase above it, accompanied by a significant recovery in momentum.

SEI Bearish Continuation: Directional Flow Assessment
The technical structure for SEI/USDC presents a plausible case for a bearish continuation. The dominant feature is a well-established downtrend, visible on both daily and weekly timeframes, with price currently trading at 0.04, significantly below all key moving averages such as the D1 EMA 50 (0.05) and the W1 EMA 50 (0.12). This long-term bearish context was recently reinforced by a critical structural event: the breakdown below the 0.05 level, which had acted as support for nearly a month. This breakdown signals a potential resumption of the primary trend. Momentum indicators corroborate this view. The weekly ADX is strong at 35.64, confirming the power of the underlying trend, while RSI on both daily (31.07) and weekly (33.59) charts remains in bearish territory. However, two factors warrant caution. The breakdown occurred on below-average volume (Volume Oscillator D1: -11.27), and the hourly chart shows price has entered a tight consolidation, suggesting a temporary equilibrium. While these elements do not invalidate the overarching bearish structure, they indicate that immediate downside acceleration is not guaranteed and a period of stabilization or a retest of the 0.05 breakdown level is possible.

Comparative Framework Verdict
Comparing the three technical frameworks for SEI/USDC, the bearish Continuation scenario emerges as the most plausible. This framework aligns with the dominant weekly downtrend (ADX W1 at 35.64) and the recent structural breakdown below the key $0.05 support level. For this scenario to remain valid, the price must treat this former support as new resistance, failing to achieve a daily close back above it. The secondary, counter-trend framework is the Range/Rebound, which is assessed as borderline. Its plausibility rests on the significant confluence of technical support at the $0.04 level, which includes weekly pivot points and Bollinger Band floors. This support, combined with oversold daily indicators, presents a case for potential bearish exhaustion and a technical bounce. However, its counter-trend nature makes it a lower-probability scenario compared to the continuation of the established trend. Finally, the bullish Breakout framework is deemed not plausible. The current market structure is one of a breakdown from support, not a compression under resistance, and key momentum indicators are deeply bearish. The primary focus for the week ahead will be the market's reaction to the $0.04 support and the $0.05 resistance, as this will determine whether the bearish trend resumes or a counter-trend rebound can gain traction.
For broader market context, readers can also review the latest related fundamental analysis for this pair.
For live market monitoring and the full interactive chart, readers can access the dedicated SEI Market Hub.
Disclaimer
CopyTradia provides technical analysis for informational and educational purposes only. This content does not constitute financial advice, investment recommendations, or trading signals. Cryptocurrency markets are highly volatile. Past performance is not indicative of future results. Always conduct your own research (DYOR) and consult a qualified financial advisor before making any investment decisions.


